
XRP price prediction: More downside ahead as XRP gains 2.31% on mixed signals

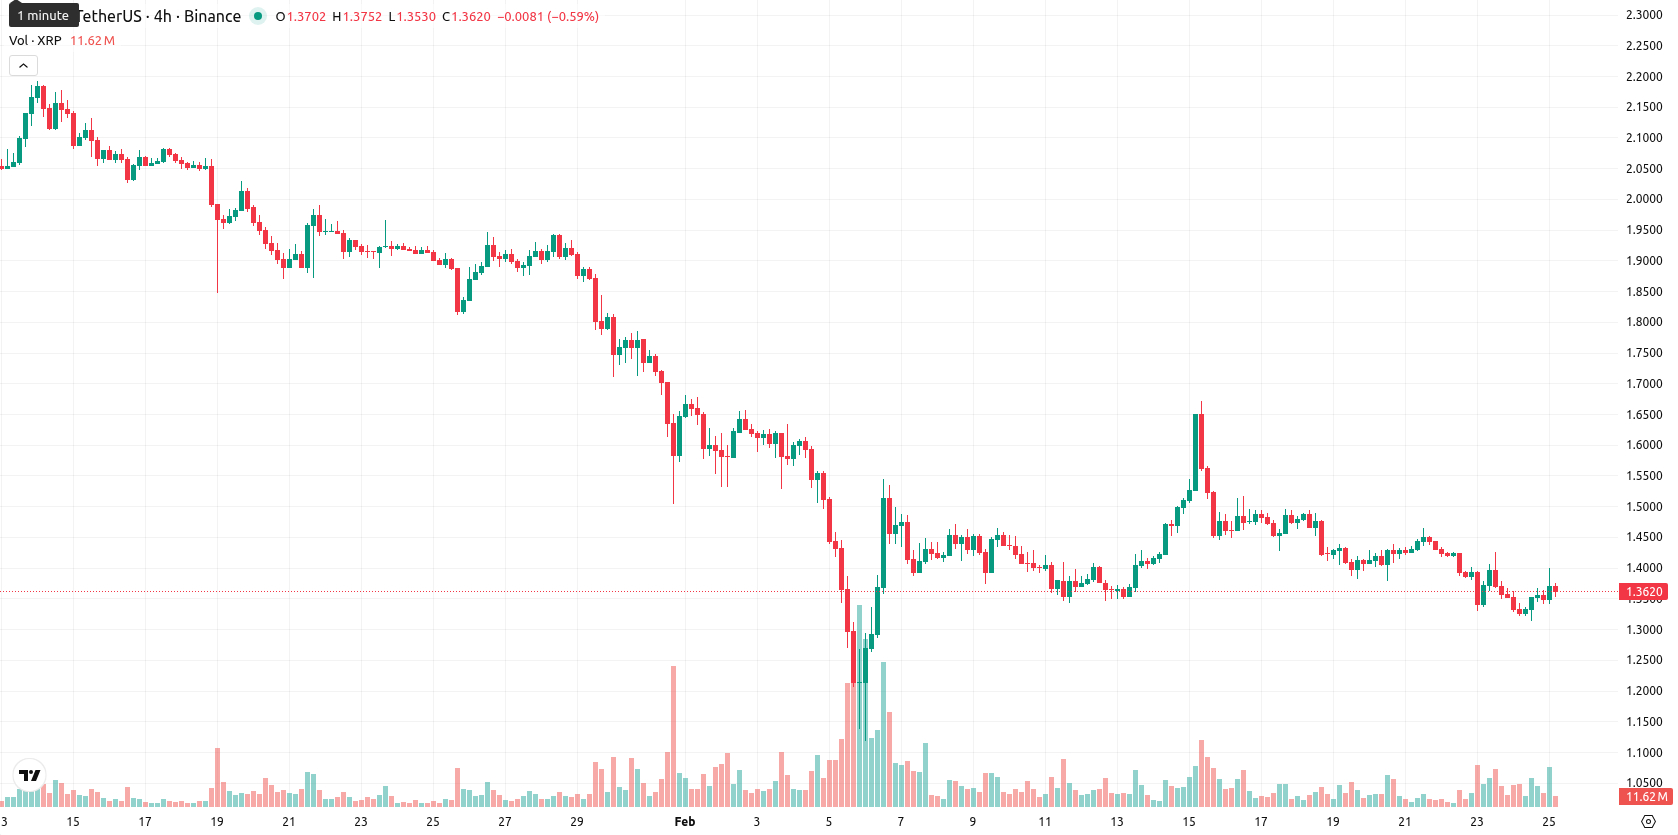
XRP (XRP) is currently trading at $1.359, sitting below the MA-20 ($1.4123), MA-50 ($1,726.0), and MA-200 ($2,312.9), which underscores persistent downside pressure across short-, medium-, and long-term trends. The Ichimoku Kijun sits at $1.4652, presenting immediate resistance above current levels.
Highlights
- The SEC continues to review the NYSE Arca proposal for the T. Rowe Price Active Crypto ETF, which includes XRP among its eligible assets.
- Arizona Senate Bill 1649, potentially establishing a state-run Digital Assets Strategic Reserve Fund featuring XRP, has advanced but faces a legislative vote and possible veto.
- XRP trades at $1.359, below its MA-20 ($1.4123), with technicals signaling strong downside momentum and a base-case consolidation range of $1.22–$1.49 for the coming week.
ETF inflows hold steady despite sustained sector outflows and legislative hurdles
The SEC has continued its review of the NYSE Arca proposal for the T. Rowe Price Active Crypto ETF, where XRP is listed among the eligible assets for the fund. Arizona's Senate Bill 1649, enabling the creation of a state-run Digital Assets Strategic Reserve Fund including XRP, has advanced but still requires a legislative vote and faces the possibility of a veto. Despite five consecutive weeks of outflows from crypto ETFs and macro-driven selling in digital assets, reported inflows for XRP ETF products have remained stable to slightly negative, with these products not recording any negative months since their launch.
Bearish momentum confirmed as oversold signals diverge with continued selling
On the momentum front, both the MACD and ADX give strong sell signals on the daily timeframe, confirming bearish momentum. The RSI and Commodity Channel Index indicate slight to moderate oversold conditions, with the Stochastic RSI also hovering near oversold, though not at extremes. Bull/Bear Power remains negative, signaling sellers dominate intraday action. The current price sits near the lower end of today’s range, suggesting moderate volatility and continued selling pressure intraday. There is a mild divergence as oscillators reflect emerging oversold conditions while price action and momentum indicators reinforce ongoing downside pressure.
Downside risk dominates outlook amid narrow probability for breakout
Looking ahead, the expected price range for the next 5 trading days is approximately $1.22 to $1.49, defining a typical volatility band relative to current levels. There is a very low probability — less than 20% — of a sustained move higher, while further declines are more likely. The baseline scenario is for XRP to consolidate sideways between $1.22 and $1.49. A sustained break above immediate resistance at $1.47 could enable a quick push toward the upper end of the range, while a close below $1.22 would indicate renewed selling and expose the asset to more pronounced losses.
Previously it was reported that XRP continues to trade within a defined range near $1.33, with technical indicators like the RSI and MACD signaling ongoing selling pressure and rallies struggling to extend. Resistance remains in the $1.40s while support has formed near $1.30, and moving averages confirm that buyers are focused on defending key levels rather than driving a breakout.


Latest XRP News


-
 Afghanistan
-
 Albania
-
 Algeria
-
 Angola
-
 Argentina
-
 Armenia
-
 Australia
-
 Austria
-
 Azerbaijan
-
 Bahamas
-
 Bahrain
-
 Bangladesh
-
 Belarus
-
 Belgium
-
 Bolivia
-
 Botswana
-
 Brazil
-
 Brunei
-
 Bulgaria
-
 Cambodia
-
 Cameroon
-
 Canada
-
 Chile
Chile
-
 China
China
-
 Colombia
-
 Congo
Congo
-
 Costa Rica
-
 Cote d'Ivoire
-
 Croatia
-
 Cuba
Cuba
-
 Cyprus
-
 Czechia
-
 DR Congo
-
 Denmark
-
 Dominican Republic
-
 Ecuador
-
 Egypt
Egypt
-
 El Salvador
-
 Estonia
-
 Eswatini
-
 Ethiopia
-
 Finland
-
 France
-
 Georgia
-
 Germany
-
 Ghana
Ghana
-
 Greece
-
 Haiti
Haiti
-
 Hong Kong
-
 Hungary
-
 India
India
-
 Indonesia
-
 Iran, Islamic republic
-
 Iraq
Iraq
-
 Ireland
-
 Israel
-
 Italy
Italy
-
 Jamaica
-
 Japan
Japan
-
 Jordan
-
 Kazakhstan
-
 Kenya
Kenya
-
 Korea
Korea
-
 Kuwait
-
 Kyrgyzstan
-
 Laos
Laos
-
 Latvia
-
 Lebanon
-
 Lesotho
-
 Libya
Libya
-
 Lithuania
-
 Luxembourg
-
 Madagascar
-
 Malaysia
-
 Malta
Malta
-
 Mauritius
-
 Mexico
-
 Moldova
-
 Mongolia
-
 Montenegro
-
 Morocco
-
 Mozambique
-
 Myanmar
-
 Namibia
-
 Nepal
Nepal
-
 Netherlands
-
 New Zealand
-
 Nigeria
-
 North Macedonia
-
 Norway
-
 Oman
Oman
-
 Pakistan
-
 Palestine
-
 Panama
-
 Papua New Guinea
-
 Paraguay
-
 Peru
Peru
-
 Philippines
-
 Poland
-
 Portugal
-
 Puerto Rico
-
 Qatar
Qatar
-
 Reunion
-
 Romania
-
 Rwanda
-
 Saudi Arabia
-
 Serbia
-
 Singapore
-
 Slovakia
-
 Slovenia
-
 Somalia
-
 South Africa
-
 Spain
Spain
-
 Sri Lanka
-
 Sweden
-
 Switzerland
-
 Syria
Syria
-
 Taiwan
-
 Tajikistan
-
 Tanzania
-
 Thailand
-
 Trinidad and Tobago
-
 Tunisia
-
 Turkey
-
 UAE
UAE
-
 Uganda
-
 Ukraine
-
 United Kingdom
-
United States
-
 Uruguay
-
 Uzbekistan
-
 Venezuela
-
 Vietnam
-
 Yemen
Yemen
-
 Zambia
-
 Zimbabwe
- Forex
- Crypto
