
Ethena rises 10.37% as volatility and technical divergence drive intraday action

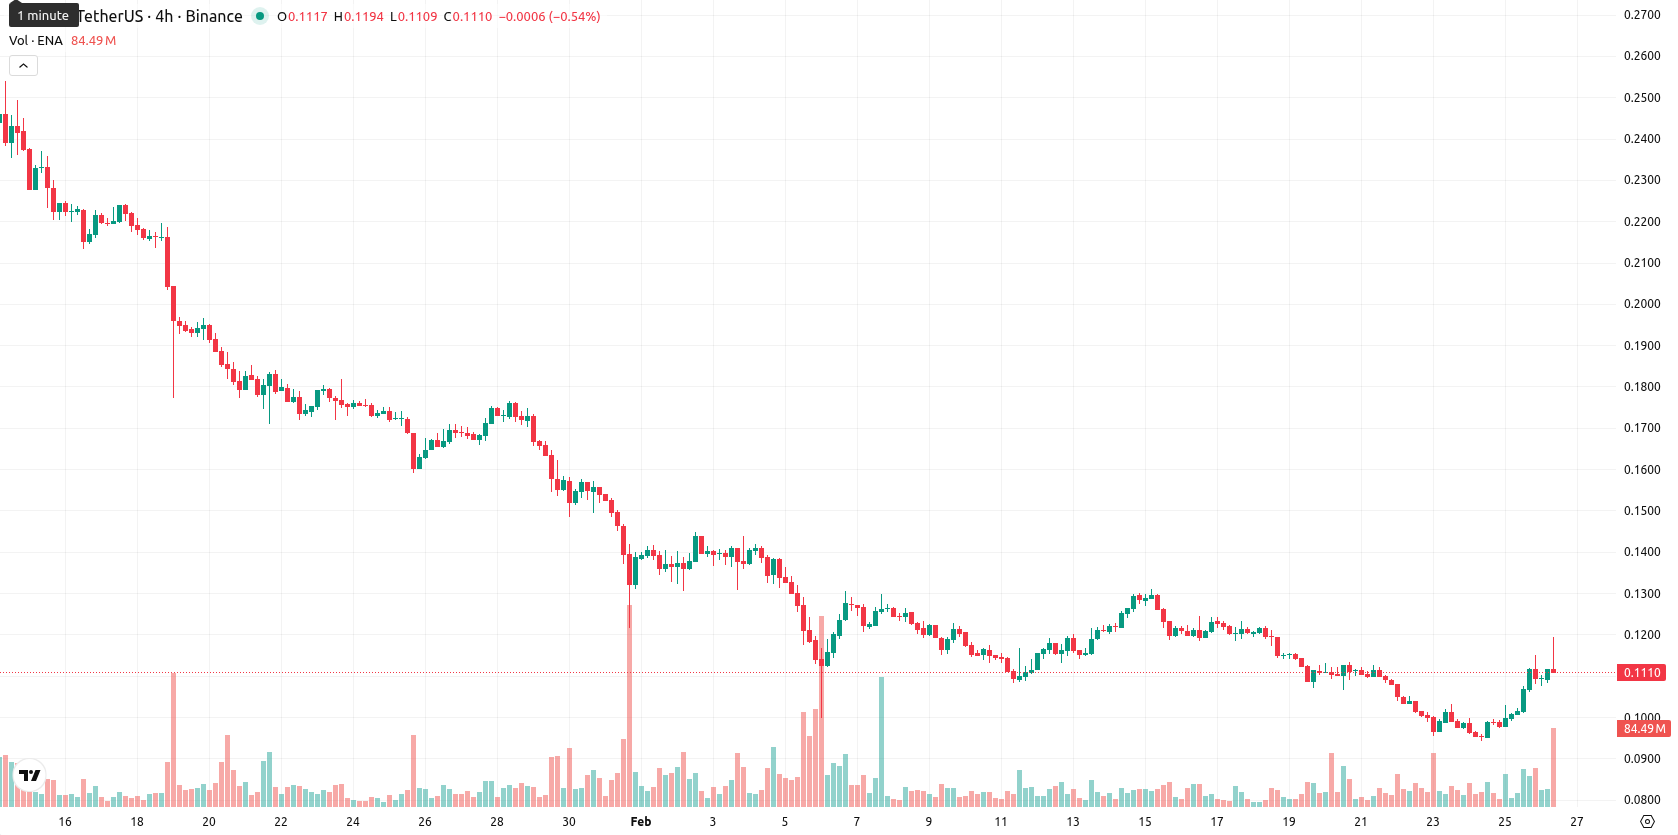
Ethena (ENA) is trading at $0.1118, up 10.37% for the day. The price is currently below the MA-20 ($0.1153) and remains well under both the MA-50 ($0.1579) and MA-200 ($0.3807), highlighting persistent downward pressure relative to key moving averages on the medium and long term.
Highlights
- ENA is trading at $0.1118, below the MA-20 ($0.1153), MA-50 ($0.1579), and MA-200 ($0.3807), signaling sustained bearish pressure.
- Despite a daily gain of 10.37%, negative momentum persists with a bearish MACD, robust ADX trend, and RSI at 38.5, reflecting long-term weakness.
- ENA is likely to consolidate between $0.1000 and $0.1240 over the next five days, with immediate resistance at $0.1241 and downside remaining more probable.
Bearish momentum diverges from overbought signals amid high volatility
Momentum remains negative on the daily timeframe, with the MACD signaling a strong sell and the ADX confirming a robust trend. In contrast, the daily upward movement (up 10.37%) signals a rebound from oversold levels. The RSI (38.5), CCI at -70.1, and Stochastic RSI (overbought at 98.1) reveal notable divergence — short-term oscillators flag overbought conditions despite persistently bearish signals from longer-term indicators. Bull/Bear Power points to recent buyer dominance, while the current price sits near the middle of today’s $0.1077 – $0.1193 range, with volatility marked by a minor gap between previous close ($0.1013) and today’s open ($0.1094), reflecting high intraday volatility and a shift from early strength toward sideways consolidation.
Range-bound outlook as bearish signals curb breakout risk
For the next five trading days, ENA is likely to consolidate within a typical volatility band ranging from $0.1000 to $0.1240. There is a very low probability (less than 20%) of a sustained upside move this week, as bearish weekly indicators remain dominant (negative MA-50-W1, RSI, ADX, MACD). The baseline scenario expects price stabilization between support at $0.1000 and resistance at $0.1240, with a bullish breakout requiring a close above $0.1241. A confirmed decline below $0.1000 could trigger a move toward lower weekly support levels.
Previously it was reported that Ethena (ENA) is trading higher intraday with a 10.66% gain but remains below key moving averages, signaling persistent bearish pressure and overall downtrend. Despite strong intraday buying and price holding near session highs, indicators such as MACD, ADX, RSI, and Stoch RSI continue to favor sellers and suggest elevated risk of a near-term pullback.


Latest Ethena News


-
 Afghanistan
-
 Albania
-
 Algeria
-
 Angola
-
 Argentina
-
 Armenia
-
 Australia
-
 Austria
-
 Azerbaijan
-
 Bahamas
-
 Bahrain
-
 Bangladesh
-
 Belarus
-
 Belgium
-
 Bolivia
-
 Botswana
-
 Brazil
-
 Brunei
-
 Bulgaria
-
 Cambodia
-
 Cameroon
-
 Canada
-
 Chile
Chile
-
 China
China
-
 Colombia
-
 Congo
Congo
-
 Costa Rica
-
 Cote d'Ivoire
-
 Croatia
-
 Cuba
Cuba
-
 Cyprus
-
 Czechia
-
 DR Congo
-
 Denmark
-
 Dominican Republic
-
 Ecuador
-
 Egypt
Egypt
-
 El Salvador
-
 Estonia
-
 Eswatini
-
 Ethiopia
-
 Finland
-
 France
-
 Georgia
-
 Germany
-
 Ghana
Ghana
-
 Greece
-
 Haiti
Haiti
-
 Hong Kong
-
 Hungary
-
 India
India
-
 Indonesia
-
 Iran, Islamic republic
-
 Iraq
Iraq
-
 Ireland
-
 Israel
-
 Italy
Italy
-
 Jamaica
-
 Japan
Japan
-
 Jordan
-
 Kazakhstan
-
 Kenya
Kenya
-
 Korea
Korea
-
 Kuwait
-
 Kyrgyzstan
-
 Laos
Laos
-
 Latvia
-
 Lebanon
-
 Lesotho
-
 Libya
Libya
-
 Lithuania
-
 Luxembourg
-
 Madagascar
-
 Malaysia
-
 Malta
Malta
-
 Mauritius
-
 Mexico
-
 Moldova
-
 Mongolia
-
 Montenegro
-
 Morocco
-
 Mozambique
-
 Myanmar
-
 Namibia
-
 Nepal
Nepal
-
 Netherlands
-
 New Zealand
-
 Nigeria
-
 North Macedonia
-
 Norway
-
 Oman
Oman
-
 Pakistan
-
 Palestine
-
 Panama
-
 Papua New Guinea
-
 Paraguay
-
 Peru
Peru
-
 Philippines
-
 Poland
-
 Portugal
-
 Puerto Rico
-
 Qatar
Qatar
-
 Reunion
-
 Romania
-
 Rwanda
-
 Saudi Arabia
-
 Serbia
-
 Singapore
-
 Slovakia
-
 Slovenia
-
 Somalia
-
 South Africa
-
 Spain
Spain
-
 Sri Lanka
-
 Sweden
-
 Switzerland
-
 Syria
Syria
-
 Taiwan
-
 Tajikistan
-
 Tanzania
-
 Thailand
-
 Trinidad and Tobago
-
 Tunisia
-
 Turkey
-
 UAE
UAE
-
 Uganda
-
 Ukraine
-
 United Kingdom
-
United States
-
 Uruguay
-
 Uzbekistan
-
 Venezuela
-
 Vietnam
-
 Yemen
Yemen
-
 Zambia
-
 Zimbabwe
- Forex
- Crypto
