
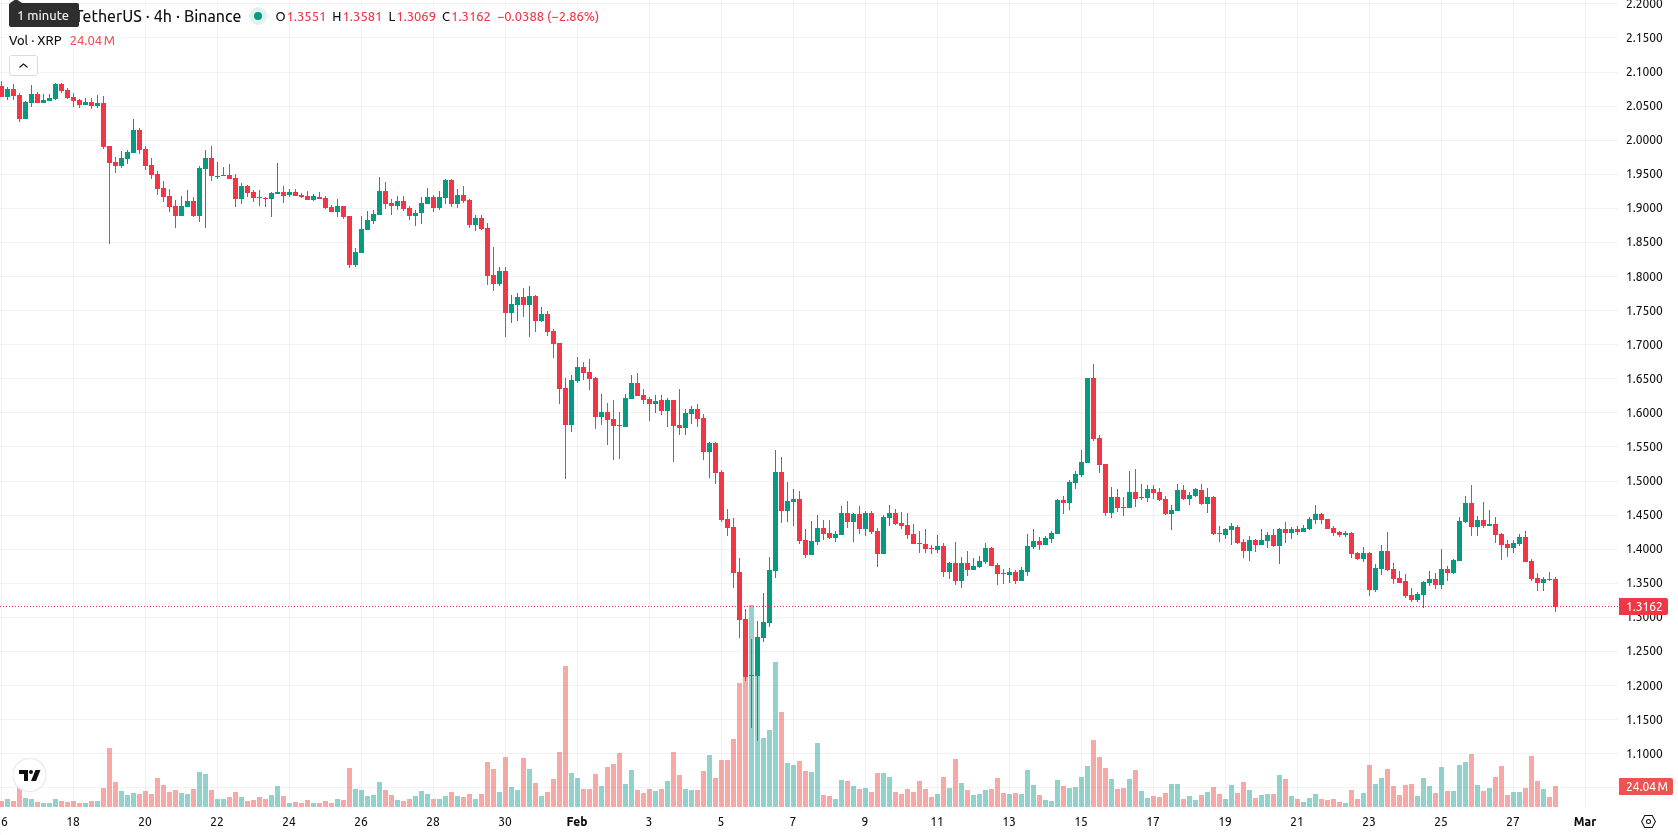
XRP slides this week with sellers dominating as technical indicators point to sustained negative structure below $1.3943 resistance – weekly forecast

XRP is trading at $1.3418, ending the week well below its MA-20 at $1.4164, MA-50 at $1.6779, and MA-200 at $2.2861. Over the last week, the asset declined modestly in both absolute and percent terms, reinforcing the ongoing bearish trend on the weekly timeframe and confirming sustained pressure below all major moving averages.
Highlights
- XRP trades at $1.3418, well below its MA-20 at $1.4164, MA-50 at $1.6779, and MA-200 at $2.2861, reflecting persistent bearish pressure across all timeframes.
- Momentum indicators including MACD, ADX, RSI, Stochastic RSI, and CCI all signal ongoing bearish strength and oversold conditions, with sellers dominating despite mild intraday buyer interest.
- XRP's likely trading range for the next five sessions is $1.2100 to $1.4700, with bearish bias unless a breakout above the Ichimoku Kijun resistance at $1.3943 occurs.
Positive sentiment shift as inflows and new products drive optimism
XRP saw significant investor interest and increased capital inflows into investment products, with spot purchase volumes on Bitrue rising by 212% and ETF-related activity fueling institutional demand. New product launches and positive regulatory attention contributed to a more optimistic outlook for XRP-based offerings. A notable security vulnerability discovery in the XRP Ledger ahead of a key mainnet update also drew focus to ongoing development and security efforts within the ecosystem.
Bearish momentum sustained as technical indicators remain negative this week
Weekly technical indicators remain negative for XRP. The price sits below all key W1 moving averages, with dynamic resistance at the Ichimoku Kijun level of $1.3943 and no clear support from weekly MAs. Weekly RSI, Stochastic RSI, and CCI are approaching oversold territory, indicating entrenched bearish momentum, while the Awesome Oscillator remains neutral on the W1 chart. Sellers dominate, with MACD and ADX also supporting the ongoing negative structure.
Further downside risk as weekly setup favors bearish continuation
For the coming week, XRP is likely to trade within the $1.2100 to $1.4700 range as bearish pressure persists. The weekly setup suggests a low probability of a sustained bounce, with downside moves favored unless the price decisively reclaims $1.3943 resistance. Should momentum turn, a sideways consolidation within the defined band is possible, but a bearish scenario remains the base case. An accelerated sell-off may trigger further testing of the $1.2100 area, while any bullish shift above current resistance would require renewed buyer commitment.
Last time, analysts noted that XRP continues to trade below its key moving averages amid prevailing bearish momentum, with momentum indicators pointing to ongoing seller dominance and the asset nearing oversold levels. Immediate resistance is seen near $1.39, and continued downside is expected unless a breakout above this level occurs, while support is noted at $1.22.


-
 Afghanistan
-
 Albania
-
 Algeria
-
 Angola
-
 Argentina
-
 Armenia
-
 Australia
-
 Austria
-
 Azerbaijan
-
 Bahamas
-
 Bahrain
-
 Bangladesh
-
 Belarus
-
 Belgium
-
 Bolivia
-
 Botswana
-
 Brazil
-
 Brunei
-
 Bulgaria
-
 Cambodia
-
 Cameroon
-
 Canada
-
 Chile
Chile
-
 China
China
-
 Colombia
-
 Congo
Congo
-
 Costa Rica
-
 Cote d'Ivoire
-
 Croatia
-
 Cuba
Cuba
-
 Cyprus
-
 Czechia
-
 DR Congo
-
 Denmark
-
 Dominican Republic
-
 Ecuador
-
 Egypt
Egypt
-
 El Salvador
-
 Estonia
-
 Eswatini
-
 Ethiopia
-
 Finland
-
 France
-
 Georgia
-
 Germany
-
 Ghana
Ghana
-
 Greece
-
 Haiti
Haiti
-
 Hong Kong
-
 Hungary
-
 India
India
-
 Indonesia
-
 Iran, Islamic republic
-
 Iraq
Iraq
-
 Ireland
-
 Israel
-
 Italy
Italy
-
 Jamaica
-
 Japan
Japan
-
 Jordan
-
 Kazakhstan
-
 Kenya
Kenya
-
 Korea
Korea
-
 Kuwait
-
 Kyrgyzstan
-
 Laos
Laos
-
 Latvia
-
 Lebanon
-
 Lesotho
-
 Libya
Libya
-
 Lithuania
-
 Luxembourg
-
 Madagascar
-
 Malaysia
-
 Malta
Malta
-
 Mauritius
-
 Mexico
-
 Moldova
-
 Mongolia
-
 Montenegro
-
 Morocco
-
 Mozambique
-
 Myanmar
-
 Namibia
-
 Nepal
Nepal
-
 Netherlands
-
 New Zealand
-
 Nigeria
-
 North Macedonia
-
 Norway
-
 Oman
Oman
-
 Pakistan
-
 Palestine
-
 Panama
-
 Papua New Guinea
-
 Paraguay
-
 Peru
Peru
-
 Philippines
-
 Poland
-
 Portugal
-
 Puerto Rico
-
 Qatar
Qatar
-
 Reunion
-
 Romania
-
 Rwanda
-
 Saudi Arabia
-
 Serbia
-
 Singapore
-
 Slovakia
-
 Slovenia
-
 Somalia
-
 South Africa
-
 Spain
Spain
-
 Sri Lanka
-
 Sweden
-
 Switzerland
-
 Syria
Syria
-
 Taiwan
-
 Tajikistan
-
 Tanzania
-
 Thailand
-
 Trinidad and Tobago
-
 Tunisia
-
 Turkey
-
 UAE
UAE
-
 Uganda
-
 Ukraine
-
 United Kingdom
-
United States
-
 Uruguay
-
 Uzbekistan
-
 Venezuela
-
 Vietnam
-
 Yemen
Yemen
-
 Zambia
-
 Zimbabwe
- Forex
- Crypto
