
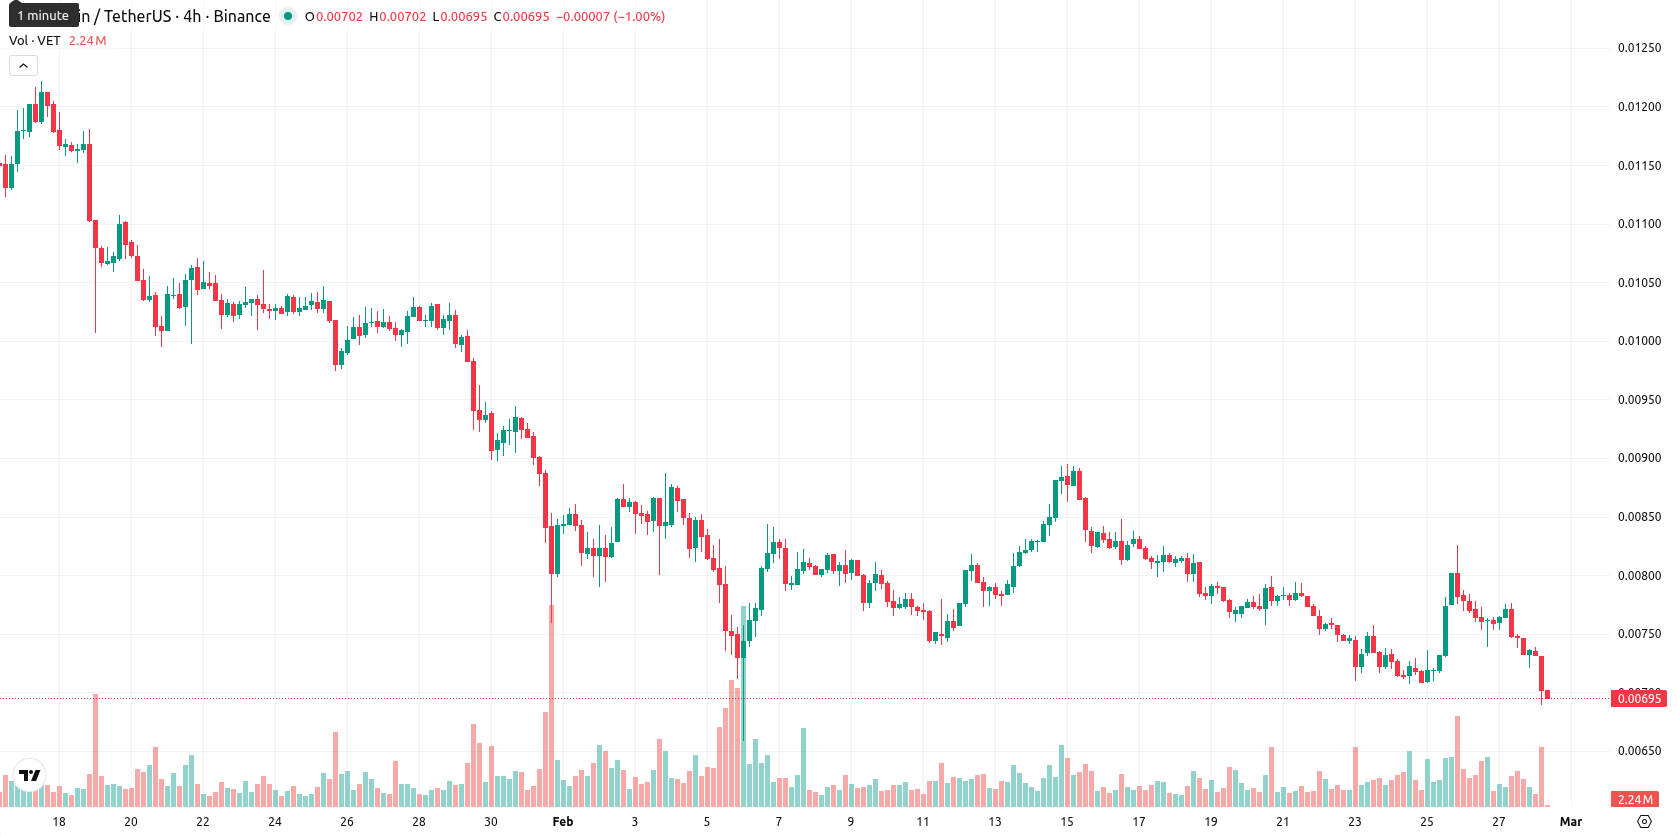
VeChain drops 7.91% as downside momentum and volatility intensify below key support

VeChain (VET) is trading significantly below the MA-20 ($0.007832), MA-50 ($0.009207), and MA-200 ($0.015768) moving averages, having declined 7.91% today. The current price is also trading under the Ichimoku Kijun at $0.007765, underscoring continued bearish momentum across all key timeframes.
 0.004843
0.00490700
0.004843
0.00490700
Highlights
- VeChain (VET) is trading well below MA-20 ($0.007832), MA-50 ($0.009207), and MA-200 ($0.015768) averages, reflecting persistent selling pressure across all timeframes.
- Momentum indicators, including MACD, ADX, RSI, and CCI, signal a decisively bearish trend with oversold readings and a high likelihood of continued declines.
- Immediate resistance is at the Ichimoku Kijun ($0.007765) with a projected range of $0.0064–$0.0075 and less than a 20% chance of a price increase this week.
Oversold signals broaden as downside trend strengthens across timeframes
Downside momentum dominates VET's technical landscape. The MACD supports strong selling pressure and the ADX signals a robust trend, while the RSI, Stochastic RSI, and CCI all indicate an oversold posture, especially on higher timeframes. Bull/Bear Power remains slightly positive on the daily chart but flips negative on lower timeframes as sellers hold control intraday. Oscillator consensus remains broadly negative with the Awesome Oscillator neutral, while a sharp drop after a narrow open gap highlights persistent volatility.
Loss risk grows as narrow rebound window meets resistance
Over the next week, VET is likely to drift within a volatility band between $0.0064 and $0.0075, which reflects recent price swings. The short-term probability of a rebound is under 20%, with indicators suggesting further downside risk. Price may move sideways within this range unless the immediate resistance at the Ichimoku Kijun is overcome. If sellers maintain their dominance and VET breaks below $0.0064, additional losses could accelerate.
Last time, analysts noted that VeChain continues to trade below its key short-, medium-, and long-term moving averages, with momentum indicators such as the MACD and ADX confirming sustained bearish control, while the RSI remains neutral to weak and the Stochastic RSI hints at a possible short-term bounce. The immediate resistance is marked by the Ichimoku Kijun level, and absent a decisive move above this, the asset is likely to consolidate within a lower range as downside risks persist.








-
 Afghanistan
-
 Albania
-
 Algeria
-
 Angola
-
 Argentina
-
 Armenia
-
 Australia
-
 Austria
-
 Azerbaijan
-
 Bahamas
-
 Bahrain
-
 Bangladesh
-
 Belarus
-
 Belgium
-
 Bolivia
-
 Botswana
-
 Brazil
-
 Brunei
-
 Bulgaria
-
 Cambodia
-
 Cameroon
-
 Canada
-
 Chile
Chile
-
 China
China
-
 Colombia
-
 Congo
Congo
-
 Costa Rica
-
 Cote d'Ivoire
-
 Croatia
-
 Cuba
Cuba
-
 Cyprus
-
 Czechia
-
 DR Congo
-
 Denmark
-
 Dominican Republic
-
 Ecuador
-
 Egypt
Egypt
-
 El Salvador
-
 Estonia
-
 Eswatini
-
 Ethiopia
-
 Finland
-
 France
-
 Georgia
-
 Germany
-
 Ghana
Ghana
-
 Greece
-
 Haiti
Haiti
-
 Hong Kong
-
 Hungary
-
 India
India
-
 Indonesia
-
 Iran, Islamic republic
-
 Iraq
Iraq
-
 Ireland
-
 Israel
-
 Italy
Italy
-
 Jamaica
-
 Japan
Japan
-
 Jordan
-
 Kazakhstan
-
 Kenya
Kenya
-
 Korea
Korea
-
 Kuwait
-
 Kyrgyzstan
-
 Laos
Laos
-
 Latvia
-
 Lebanon
-
 Lesotho
-
 Libya
Libya
-
 Lithuania
-
 Luxembourg
-
 Madagascar
-
 Malaysia
-
 Malta
Malta
-
 Mauritius
-
 Mexico
-
 Moldova
-
 Mongolia
-
 Montenegro
-
 Morocco
-
 Mozambique
-
 Myanmar
-
 Namibia
-
 Nepal
Nepal
-
 Netherlands
-
 New Zealand
-
 Nigeria
-
 North Macedonia
-
 Norway
-
 Oman
Oman
-
 Pakistan
-
 Palestine
-
 Panama
-
 Papua New Guinea
-
 Paraguay
-
 Peru
Peru
-
 Philippines
-
 Poland
-
 Portugal
-
 Puerto Rico
-
 Qatar
Qatar
-
 Reunion
-
 Romania
-
 Rwanda
-
 Saudi Arabia
-
 Serbia
-
 Singapore
-
 Slovakia
-
 Slovenia
-
 Somalia
-
 South Africa
-
 Spain
Spain
-
 Sri Lanka
-
 Sweden
-
 Switzerland
-
 Syria
Syria
-
 Taiwan
-
 Tajikistan
-
 Tanzania
-
 Thailand
-
 Trinidad and Tobago
-
 Tunisia
-
 Turkey
-
 UAE
UAE
-
 Uganda
-
 Ukraine
-
 United Kingdom
-
United States
-
 Uruguay
-
 Uzbekistan
-
 Venezuela
-
 Vietnam
-
 Yemen
Yemen
-
 Zambia
-
 Zimbabwe
- Forex
- Crypto











