
Bearish momentum and technical breakdown — THORChain slides 8.52%

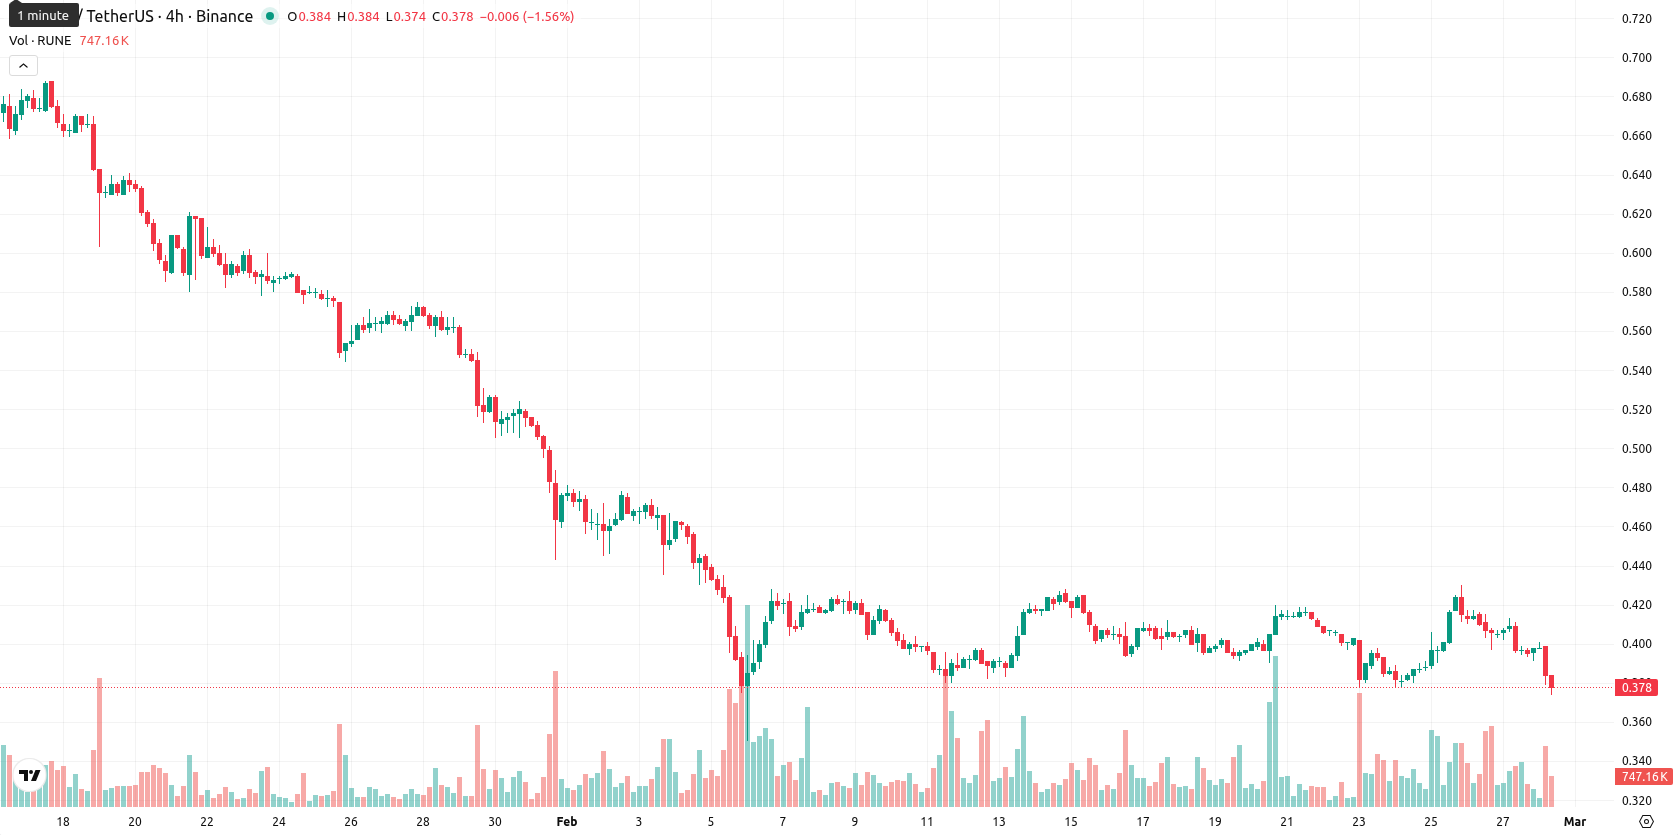
THORChain (RUNE) is trading at $0.376, marking a daily decline of 8.52%. The price remains below its MA-20 ($0.4040), MA-50 ($0.4947), and MA-200 ($0.8145), indicating persistent downward momentum across all observed timeframes.
 0.456
0.4510
0.456
0.4510
Highlights
- RUNE is trading at $0.376, below its MA-20, MA-50, and MA-200, indicating persistent seller pressure and a strong bearish trend across all timeframes.
- The daily chart shows negative momentum—MACD and ADX are bearish, RSI is at 39, and today’s price dropped 8.52%, confirming high volatility and seller dominance.
- Key levels are immediate resistance at $0.4140 and support at $0.340, with a projected five-day trading range of $0.340 to $0.415 and less than 20% probability of a significant upward move.
Bearish trend pressure intensifies as resistance and momentum indicators align
Technically, the Ichimoku Kijun sits at $0.4140, above the current price, establishing immediate resistance at this level. On the daily chart, negative momentum is confirmed by bearish MACD signals and a high ADX value. The RSI reads 39, pointing to potential further downside, while the Stochastic RSI and Commodity Channel Index do not signal oversold conditions on D1, though shorter timeframes are nearing oversold. Bull/Bear Power direction is classified as "Buy" but near zero, suggesting no clear intraday dominance between buyers and sellers, yet the prevailing trend is bearish. Volatility is high with today's range at $0.375 – $0.401 and selling pressure persistent throughout the session.
Further declines favored as low reversal odds cap short-term range
Over the next five trading days, the expected trading corridor is $0.340 to $0.415, reflecting typical volatility at current levels. With all trend and momentum indicators on both daily and weekly timeframes signaling "Sell" and a very low probability (less than 20%) of an upward reversal, further declines are more likely. The baseline scenario anticipates sideways consolidation within this range, unless a breakout above $0.4140 or a breakdown below $0.340 triggers directional follow-through.
Recently, analysts noted that THORChain (RUNE) is trading above the short-term MA-20 but remains below its key medium- and long-term moving averages, while momentum indicators show strong bearish signals and volatility remains elevated. Despite oversold RSI and other oscillators hinting at potential for a short-term bounce, sellers maintain control and the asset faces resistance near the Ichimoku Kijun level with support just below current pricing.


Latest THORChain News






-
 Afghanistan
-
 Albania
-
 Algeria
-
 Angola
-
 Argentina
-
 Armenia
-
 Australia
-
 Austria
-
 Azerbaijan
-
 Bahamas
-
 Bahrain
-
 Bangladesh
-
 Belarus
-
 Belgium
-
 Bolivia
-
 Botswana
-
 Brazil
-
 Brunei
-
 Bulgaria
-
 Cambodia
-
 Cameroon
-
 Canada
-
 Chile
Chile
-
 China
China
-
 Colombia
-
 Congo
Congo
-
 Costa Rica
-
 Cote d'Ivoire
-
 Croatia
-
 Cuba
Cuba
-
 Cyprus
-
 Czechia
-
 DR Congo
-
 Denmark
-
 Dominican Republic
-
 Ecuador
-
 Egypt
Egypt
-
 El Salvador
-
 Estonia
-
 Eswatini
-
 Ethiopia
-
 Finland
-
 France
-
 Georgia
-
 Germany
-
 Ghana
Ghana
-
 Greece
-
 Haiti
Haiti
-
 Hong Kong
-
 Hungary
-
 India
India
-
 Indonesia
-
 Iran, Islamic republic
-
 Iraq
Iraq
-
 Ireland
-
 Israel
-
 Italy
Italy
-
 Jamaica
-
 Japan
Japan
-
 Jordan
-
 Kazakhstan
-
 Kenya
Kenya
-
 Korea
Korea
-
 Kuwait
-
 Kyrgyzstan
-
 Laos
Laos
-
 Latvia
-
 Lebanon
-
 Lesotho
-
 Libya
Libya
-
 Lithuania
-
 Luxembourg
-
 Madagascar
-
 Malaysia
-
 Malta
Malta
-
 Mauritius
-
 Mexico
-
 Moldova
-
 Mongolia
-
 Montenegro
-
 Morocco
-
 Mozambique
-
 Myanmar
-
 Namibia
-
 Nepal
Nepal
-
 Netherlands
-
 New Zealand
-
 Nigeria
-
 North Macedonia
-
 Norway
-
 Oman
Oman
-
 Pakistan
-
 Palestine
-
 Panama
-
 Papua New Guinea
-
 Paraguay
-
 Peru
Peru
-
 Philippines
-
 Poland
-
 Portugal
-
 Puerto Rico
-
 Qatar
Qatar
-
 Reunion
-
 Romania
-
 Rwanda
-
 Saudi Arabia
-
 Serbia
-
 Singapore
-
 Slovakia
-
 Slovenia
-
 Somalia
-
 South Africa
-
 Spain
Spain
-
 Sri Lanka
-
 Sweden
-
 Switzerland
-
 Syria
Syria
-
 Taiwan
-
 Tajikistan
-
 Tanzania
-
 Thailand
-
 Trinidad and Tobago
-
 Tunisia
-
 Turkey
-
 UAE
UAE
-
 Uganda
-
 Ukraine
-
 United Kingdom
-
United States
-
 Uruguay
-
 Uzbekistan
-
 Venezuela
-
 Vietnam
-
 Yemen
Yemen
-
 Zambia
-
 Zimbabwe
- Forex
- Crypto












