
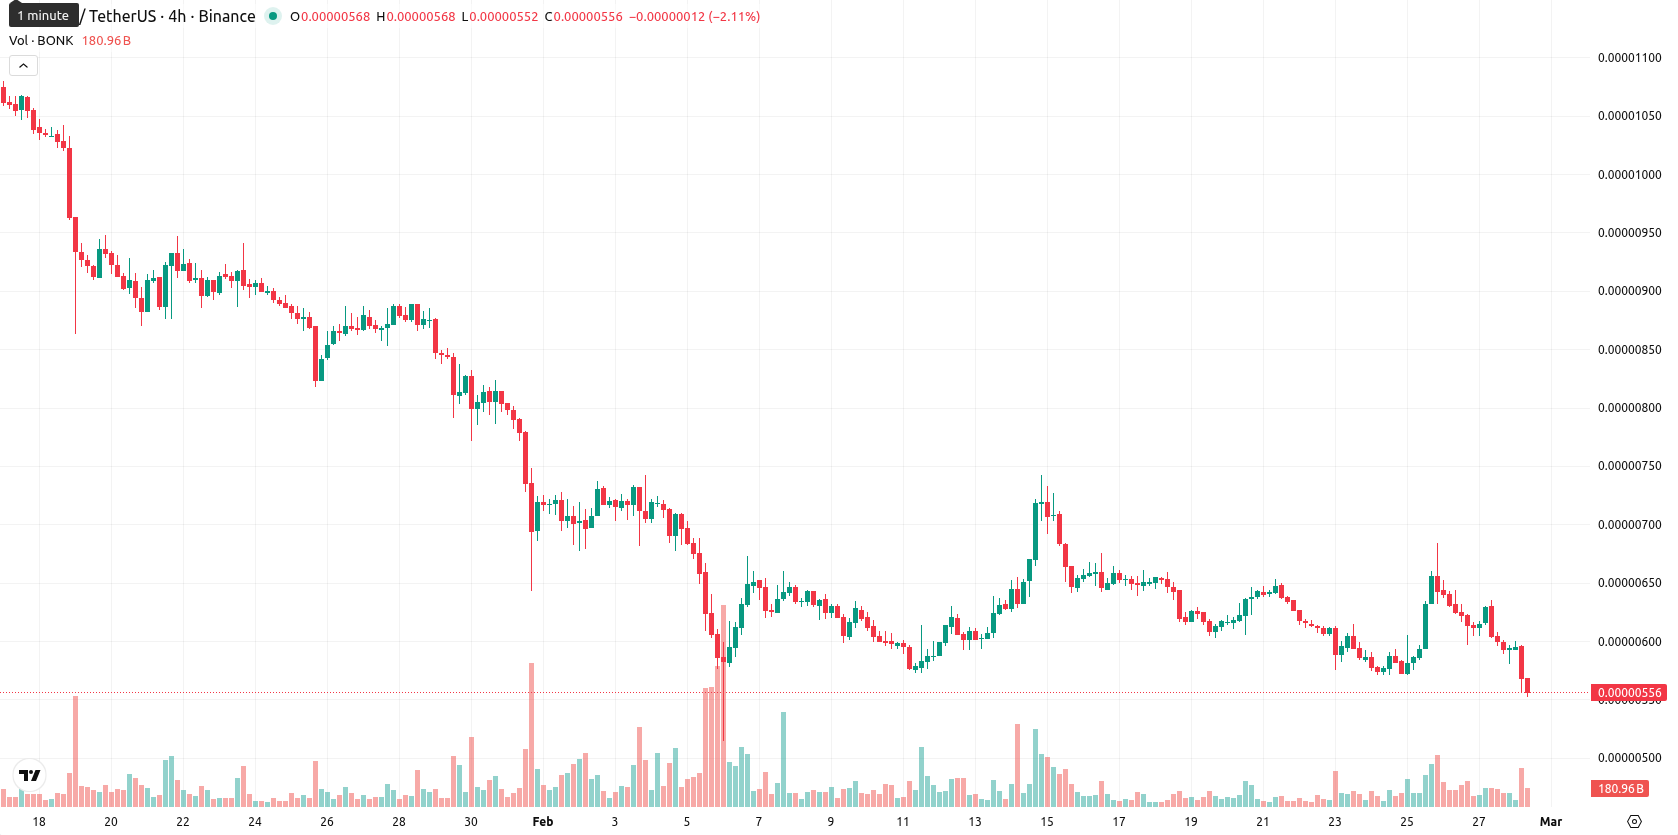
-10.34% for Bonk — Downside pressure persists with key levels broken

Bonk (BONK) is trading at $0.0000056, reflecting a 10.34% drop for the day and positioning the asset notably below the MA-20 at $0.00000624, the MA-50 at $0.00000780, and the MA-200 at $0.00001346. This places Bonk under consistent downward pressure across short, medium, and long-term timeframes.
Highlights
- BONK is trading at $0.0000056, below key moving averages (MA-20 at $0.00000624, MA-50 at $0.00000780, MA-200 at $0.00001346), indicating persistent downward pressure across all timeframes.
- Momentum indicators including MACD, ADX, RSI, Commodity Channel Index, and Stochastic RSI all signal bearish control, with sellers dominating and upside momentum lacking.
- The immediate resistance lies at the Ichimoku Kijun ($0.00000628), while a bearish scenario could see downside testing $0.0000050 amid a projected range for the next five days of $0.0000050–$0.0000062.
Bearish momentum dominates as technical indicators confirm persistent weakness
Price action remains weak, as momentum indicators including MACD and ADX signal sell conditions and dominant bearish control. RSI sits in the lower 40s, indicating a lack of buying strength; both the Commodity Channel Index and Stochastic RSI confirm muted upside momentum, while Bull/Bear Power shows only a mild buy signal with sellers dominating. Bonk is currently trading near the lower end of today's $0.0000055 – $0.000006 range, with volatility staying elevated as downside pressure has prevailed from the session open. The Ichimoku Kijun level of $0.00000628 serves as immediate resistance above the current price, aligning with persistent bearish signals across oscillators and trend measurements.
Limited rebound prospects as downside risk stays elevated
For the next five days, Bonk's typical volatility is expected within a $0.0000050 – $0.0000062 band relative to current levels. The likelihood of a price increase is very low (less than 20%), making further declines more probable. The base case scenario is ongoing sideways movement between immediate resistance and support, with any sustained move above $0.00000628 required for a bullish shift. On the downside, a push below $0.0000050 could occur should negative momentum accelerate.
Last time, analysts noted that Bonk (BONK) is exhibiting a strong bearish trend, trading below its key short-, medium-, and long-term moving averages as well as the Ichimoku Kijun dynamic resistance, with price action showing persistent selling pressure and sustained downside momentum confirmed by MACD, ADX, and most oscillators. While RSI sits just above oversold and short-term exhaustion is possible, there is currently no significant lower support nearby, and sellers continue to dominate intraday activity.


-
 Afghanistan
-
 Albania
-
 Algeria
-
 Angola
-
 Argentina
-
 Armenia
-
 Australia
-
 Austria
-
 Azerbaijan
-
 Bahamas
-
 Bahrain
-
 Bangladesh
-
 Belarus
-
 Belgium
-
 Bolivia
-
 Botswana
-
 Brazil
-
 Brunei
-
 Bulgaria
-
 Cambodia
-
 Cameroon
-
 Canada
-
 Chile
Chile
-
 China
China
-
 Colombia
-
 Congo
Congo
-
 Costa Rica
-
 Cote d'Ivoire
-
 Croatia
-
 Cuba
Cuba
-
 Cyprus
-
 Czechia
-
 DR Congo
-
 Denmark
-
 Dominican Republic
-
 Ecuador
-
 Egypt
Egypt
-
 El Salvador
-
 Estonia
-
 Eswatini
-
 Ethiopia
-
 Finland
-
 France
-
 Georgia
-
 Germany
-
 Ghana
Ghana
-
 Greece
-
 Haiti
Haiti
-
 Hong Kong
-
 Hungary
-
 India
India
-
 Indonesia
-
 Iran, Islamic republic
-
 Iraq
Iraq
-
 Ireland
-
 Israel
-
 Italy
Italy
-
 Jamaica
-
 Japan
Japan
-
 Jordan
-
 Kazakhstan
-
 Kenya
Kenya
-
 Korea
Korea
-
 Kuwait
-
 Kyrgyzstan
-
 Laos
Laos
-
 Latvia
-
 Lebanon
-
 Lesotho
-
 Libya
Libya
-
 Lithuania
-
 Luxembourg
-
 Madagascar
-
 Malaysia
-
 Malta
Malta
-
 Mauritius
-
 Mexico
-
 Moldova
-
 Mongolia
-
 Montenegro
-
 Morocco
-
 Mozambique
-
 Myanmar
-
 Namibia
-
 Nepal
Nepal
-
 Netherlands
-
 New Zealand
-
 Nigeria
-
 North Macedonia
-
 Norway
-
 Oman
Oman
-
 Pakistan
-
 Palestine
-
 Panama
-
 Papua New Guinea
-
 Paraguay
-
 Peru
Peru
-
 Philippines
-
 Poland
-
 Portugal
-
 Puerto Rico
-
 Qatar
Qatar
-
 Reunion
-
 Romania
-
 Rwanda
-
 Saudi Arabia
-
 Serbia
-
 Singapore
-
 Slovakia
-
 Slovenia
-
 Somalia
-
 South Africa
-
 Spain
Spain
-
 Sri Lanka
-
 Sweden
-
 Switzerland
-
 Syria
Syria
-
 Taiwan
-
 Tajikistan
-
 Tanzania
-
 Thailand
-
 Trinidad and Tobago
-
 Tunisia
-
 Turkey
-
 UAE
UAE
-
 Uganda
-
 Ukraine
-
 United Kingdom
-
United States
-
 Uruguay
-
 Uzbekistan
-
 Venezuela
-
 Vietnam
-
 Yemen
Yemen
-
 Zambia
-
 Zimbabwe
- Forex
- Crypto
