
BCH up 2.51% as weekly indicators warn of sideways-to-bearish action between $440 and $480 – weekly report

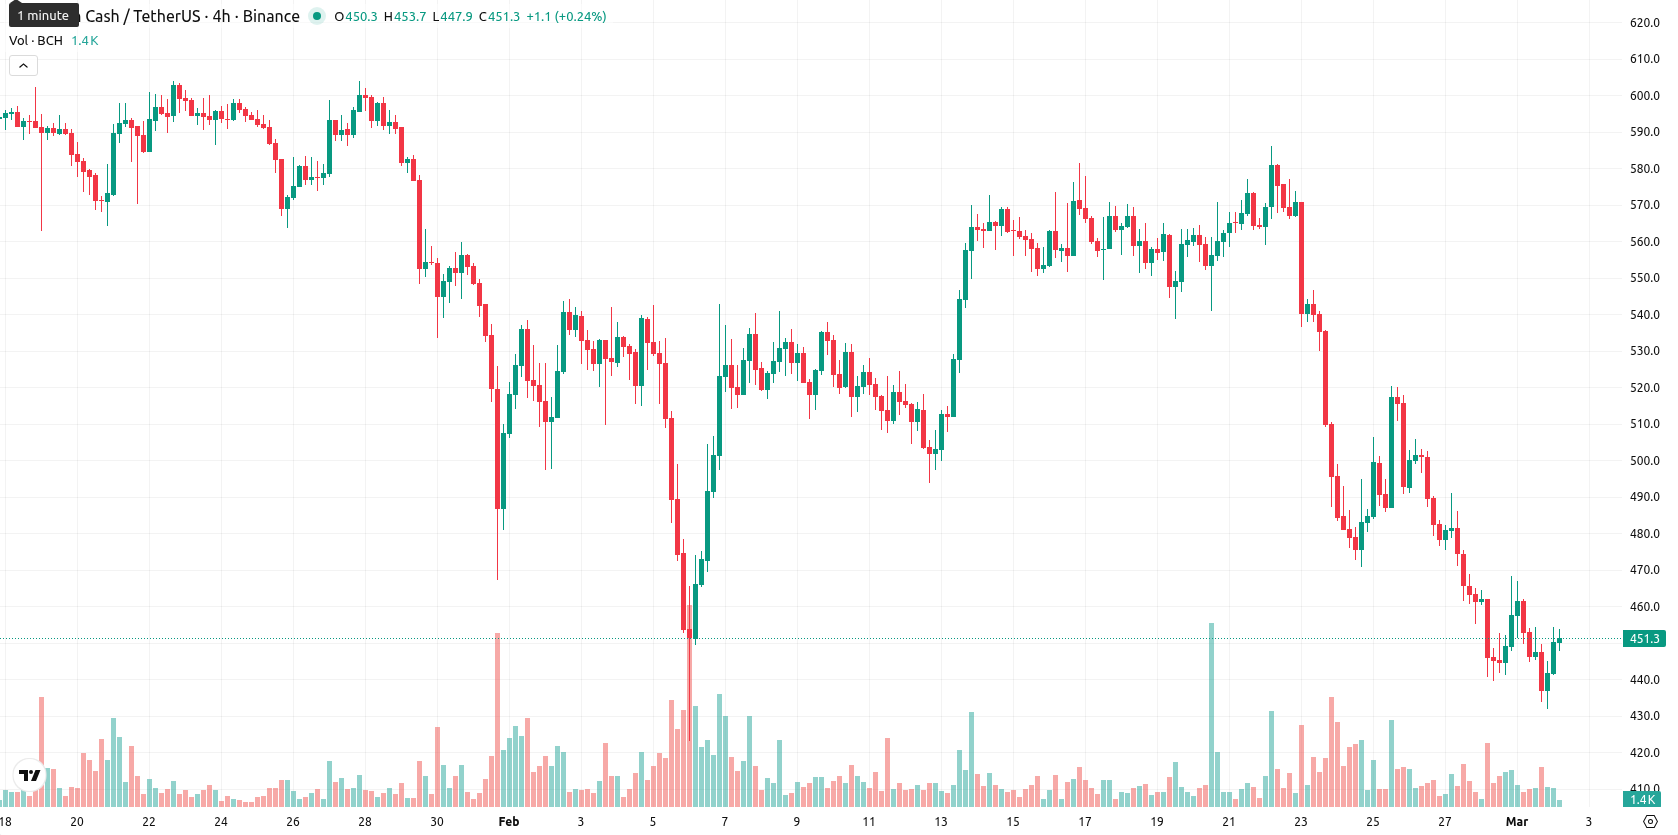
Bitcoin Cash (BCH) is trading at $451.70, having declined $5.60 or 1.22% over the past week. The asset remains significantly below its weekly 20-day ($524.08), 50-day ($550.16), and 200-day ($557.60) moving averages, signaling continued seller control across timeframes.
Highlights
- BCH trades at $451.70, significantly below the 20-day ($524.08), 50-day ($550.16), and 200-day ($557.60) Moving Averages, indicating persistent seller dominance.
- Daily momentum indicators (MACD, ADX, RSI) remain weak, with multiple oversold signals and intraday Bull/Bear Power confirming strong selling pressure.
- The key support zone is $410–$420, with resistance at $504.60 (Ichimoku Kijun); price is projected to consolidate between $440–$480, maintaining a sideways-to-bearish bias.
Momentum weakens this week as technicals confirm seller dominance
On the weekly timeframe, BCH is notably trading under major moving averages (20, 50, and 200), with dynamic resistance at the Ichimoku Kijun level of $504.60 and no significant dynamic support nearby. Technical indicators reflect weakening momentum: the weekly RSI and Commodity Channel Index signal oversold conditions, with Stochastic RSI at zero, confirming seller dominance for the week. Weekly Bull/Bear Power remains negative, underscoring sustained selling pressure.
Further downside likely next week unless reversal signals emerge
For the next 5–7 trading days, BCH is expected to move within a sideways-to-bearish range centered between $440 and $480. Bulls require a clear break above $505 for any chance of upside toward $500–$520, but the probability of a near-term rally remains below 20%. Further declines are likely if BCH slips below $440, in which case $420–$410 becomes the next support. Unless weekly indicators generate a stronger reversal, the broader bias remains bearish.
Previously it was reported that Bitcoin Cash is exhibiting persistent bearish momentum, trading below key moving averages with all major technical indicators—including MACD, ADX, RSI, Stochastic RSI, and CCI—signaling oversold conditions and continued seller dominance. The asset faces immediate resistance at $504.60, and is expected to remain volatile within a sideways-to-lower range, with further declines likely if support levels are breached.


Latest Bitcoin Cash News


-
 Afghanistan
-
 Albania
-
 Algeria
-
 Angola
-
 Argentina
-
 Armenia
-
 Australia
-
 Austria
-
 Azerbaijan
-
 Bahamas
-
 Bahrain
-
 Bangladesh
-
 Belarus
-
 Belgium
-
 Bolivia
-
 Botswana
-
 Brazil
-
 Brunei
-
 Bulgaria
-
 Cambodia
-
 Cameroon
-
 Canada
-
 Chile
Chile
-
 China
China
-
 Colombia
-
 Congo
Congo
-
 Costa Rica
-
 Cote d'Ivoire
-
 Croatia
-
 Cuba
Cuba
-
 Cyprus
-
 Czechia
-
 DR Congo
-
 Denmark
-
 Dominican Republic
-
 Ecuador
-
 Egypt
Egypt
-
 El Salvador
-
 Estonia
-
 Eswatini
-
 Ethiopia
-
 Finland
-
 France
-
 Georgia
-
 Germany
-
 Ghana
Ghana
-
 Greece
-
 Haiti
Haiti
-
 Hong Kong
-
 Hungary
-
 India
India
-
 Indonesia
-
 Iran, Islamic republic
-
 Iraq
Iraq
-
 Ireland
-
 Israel
-
 Italy
Italy
-
 Jamaica
-
 Japan
Japan
-
 Jordan
-
 Kazakhstan
-
 Kenya
Kenya
-
 Korea
Korea
-
 Kuwait
-
 Kyrgyzstan
-
 Laos
Laos
-
 Latvia
-
 Lebanon
-
 Lesotho
-
 Libya
Libya
-
 Lithuania
-
 Luxembourg
-
 Madagascar
-
 Malaysia
-
 Malta
Malta
-
 Mauritius
-
 Mexico
-
 Moldova
-
 Mongolia
-
 Montenegro
-
 Morocco
-
 Mozambique
-
 Myanmar
-
 Namibia
-
 Nepal
Nepal
-
 Netherlands
-
 New Zealand
-
 Nigeria
-
 North Macedonia
-
 Norway
-
 Oman
Oman
-
 Pakistan
-
 Palestine
-
 Panama
-
 Papua New Guinea
-
 Paraguay
-
 Peru
Peru
-
 Philippines
-
 Poland
-
 Portugal
-
 Puerto Rico
-
 Qatar
Qatar
-
 Reunion
-
 Romania
-
 Rwanda
-
 Saudi Arabia
-
 Serbia
-
 Singapore
-
 Slovakia
-
 Slovenia
-
 Somalia
-
 South Africa
-
 Spain
Spain
-
 Sri Lanka
-
 Sweden
-
 Switzerland
-
 Syria
Syria
-
 Taiwan
-
 Tajikistan
-
 Tanzania
-
 Thailand
-
 Trinidad and Tobago
-
 Tunisia
-
 Turkey
-
 UAE
UAE
-
 Uganda
-
 Ukraine
-
 United Kingdom
-
United States
-
 Uruguay
-
 Uzbekistan
-
 Venezuela
-
 Vietnam
-
 Yemen
Yemen
-
 Zambia
-
 Zimbabwe
- Forex
- Crypto
