
HBAR trades under key resistance as Kijun support at $0.0899 and neutral oscillators guide consolidation – weekly report

Hedera (HBAR) is currently trading at $0.098, recording a positive movement of 2.35% over the last week. Despite the modest weekly gain, price action remains structurally weak. The asset remains just below its MA-20 at $0.0983 and faces immediate resistance at the MA-50 of $0.1017, with a continued bearish outlook as it stays well under the MA-200 at $0.1596.
HBAR price prediction
Current price:
$ 0.071
0.0004
0.54%
Real-time Data
13:58
Daily range
0.0695
 0.0715
Weekly range
0.0688
0.0776
Loading...
Highlights
- HBAR is trading at $0.098, just below the MA-20 and well under the MA-200 at $0.1596, pointing to ongoing selling pressure.
- Momentum indicators such as MACD, ADX, and RSI are weak or neutral, with the RSI below 50, supporting a broadly bearish short- and medium-term outlook.
- For the week, HBAR is expected to remain range-bound between $0.089 support and $0.1017 resistance, with less than a 20% probability of a price increase.
Institutional focus increases as network milestones and patent news shape sentiment
Hedera reported an active period highlighted by its self-reported market capitalization exceeding $4.28 billion and more than 43 billion HBAR tokens in circulation. The network was also referenced within a recent U.S. government patent for nationwide road usage, spotlighting a real-world infrastructure application leveraging Hashgraph technology. These developments underscore institutional interest in Hedera’s blockchain utility.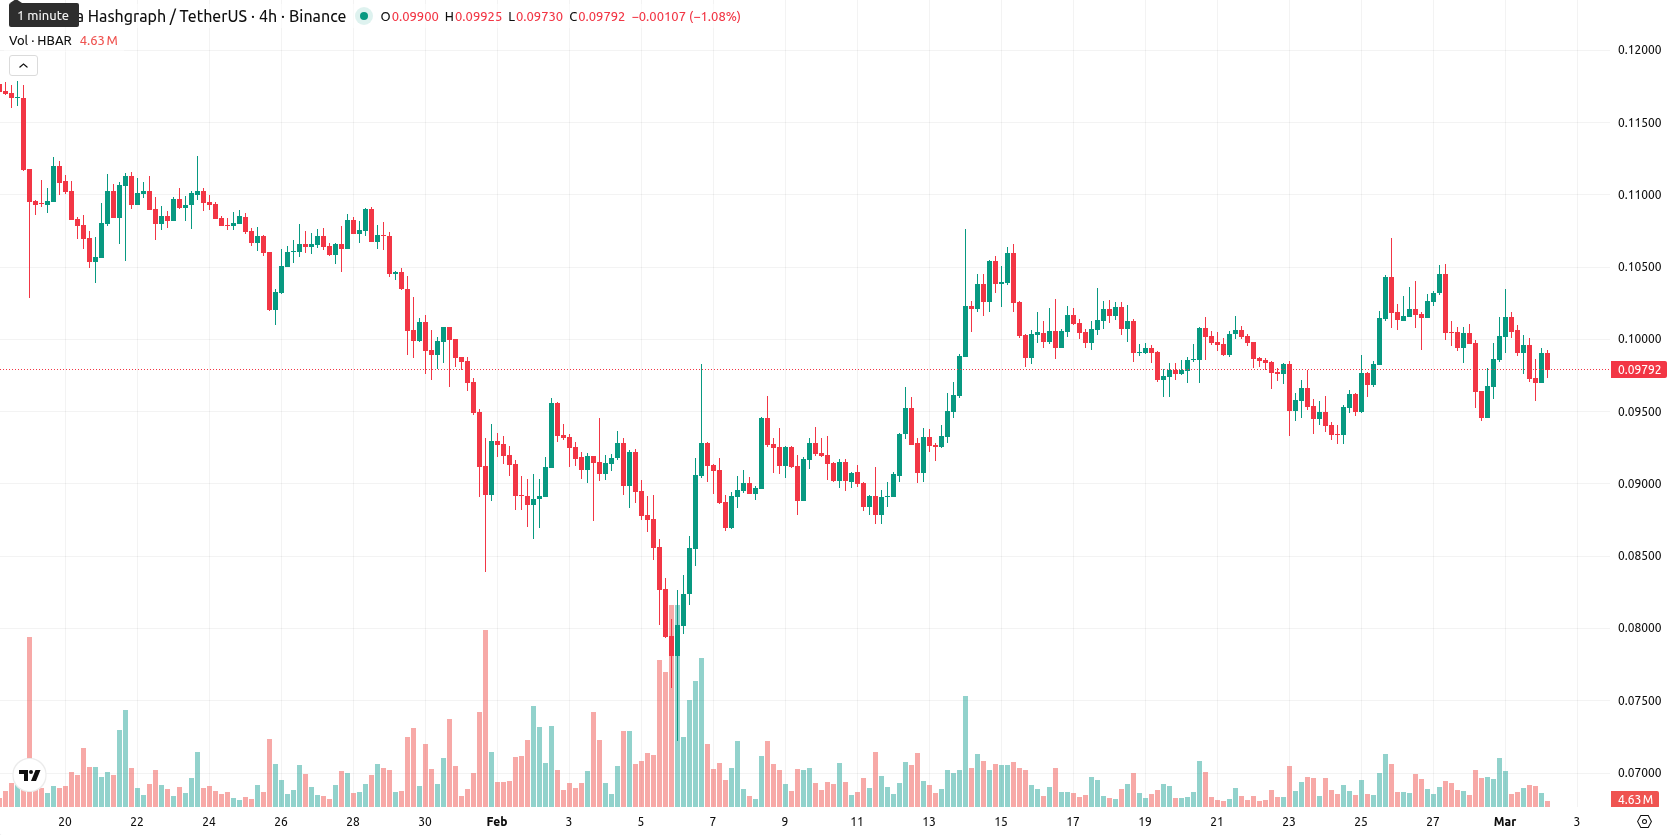
Momentum remains weak as all major averages cap upside during week
On the weekly chart, HBAR remains below all major moving averages, with the MA-20 just overhead at $0.0983, the MA-50 providing resistance at $0.1017, and the MA-200 far above at $0.1596. Key dynamic support is identified at the Ichimoku Kijun of $0.0899, while weekly resistance is found near $0.1017. Weekly RSI is below 50, reinforcing a bearish momentum bias, and most other W1 oscillators, including MACD and CCI, signal neutrality or waning trend strength. This technical setup indicates continued downward pressure with limited upside momentum.Rangebound outlook favored as reversal odds stay low for coming week
For the next 5–7 trading days, HBAR is expected to trade within a revised range of $0.089 to $0.108, reflecting typical volatility on the weekly timeframe. The prevailing scenario is a sideways consolidation between structural support at $0.089 and resistance at $0.1017, with a potential for short tests of the $0.098 level. A low probability of bullish reversal exists unless price action sustains above $0.102, while a break beneath $0.089 support could open the way to further decline and establish new short-term lows.
Jainam Mehta, market strategist, notes that HBAR ended the week with mild losses and continues to face technical resistance at both the MA-20 and MA-50 levels. He points out that institutional attention from recent real-world infrastructure news has not yet shifted the weak trend, with price momentum and most oscillators still bearish. In the coming week, Mehta expects consolidation between $0.089 and $0.1017, seeing limited prospects for a breakout unless HBAR firmly exceeds $0.102 on strong volume. "For now, I’m watching for possible range trades, but any breakdown below $0.089 would signal renewed downside risk this week."
Previously it was reported that Hedera is experiencing sustained selling pressure, trading just below the 20-day moving average and clearly beneath both its 50- and 200-day levels, as increased network activity and mixed momentum indicators fail to counteract prevailing downside risk. Despite neutral-to-positive daily readings from the RSI, Bull/Bear Power, and Awesome Oscillator, persistent short- and long-term bearish signals and recent high volatility suggest a high likelihood of continued range-bound movement with further declines probable unless resistance near $0.1000 is reclaimed.
Source of Data:
HBAR Price Analysis by TU
The analysis is based on a proprietary model combining technical, on-chain, and expert data. Not investment advice. See
methodology
This material may contain third-party opinions, none of the data and information on this webpage constitutes investment advice according to our Disclaimer. While we adhere to strict Editorial Integrity, this post may contain references to products from our partners.
Subscribe to TU news

Did you like the article?


Weekly Top Bonuses

Top News


Top 5 companies for you

United States
-
 Afghanistan
-
 Albania
-
 Algeria
-
 Angola
-
 Argentina
-
 Armenia
-
 Australia
-
 Austria
-
 Azerbaijan
-
 Bahamas
-
 Bahrain
-
 Bangladesh
-
 Belarus
-
 Belgium
-
 Bolivia
-
 Botswana
-
 Brazil
-
 Brunei
-
 Bulgaria
-
 Cambodia
-
 Cameroon
-
 Canada
-
 Chile
Chile
-
 China
China
-
 Colombia
-
 Congo
Congo
-
 Costa Rica
-
 Cote d'Ivoire
-
 Croatia
-
 Cuba
Cuba
-
 Cyprus
-
 Czechia
-
 DR Congo
-
 Denmark
-
 Dominican Republic
-
 Ecuador
-
 Egypt
Egypt
-
 El Salvador
-
 Estonia
-
 Eswatini
-
 Ethiopia
-
 Finland
-
 France
-
 Georgia
-
 Germany
-
 Ghana
Ghana
-
 Greece
-
 Haiti
Haiti
-
 Hong Kong
-
 Hungary
-
 India
India
-
 Indonesia
-
 Iran, Islamic republic
-
 Iraq
Iraq
-
 Ireland
-
 Israel
-
 Italy
Italy
-
 Jamaica
-
 Japan
Japan
-
 Jordan
-
 Kazakhstan
-
 Kenya
Kenya
-
 Korea
Korea
-
 Kuwait
-
 Kyrgyzstan
-
 Laos
Laos
-
 Latvia
-
 Lebanon
-
 Lesotho
-
 Libya
Libya
-
 Lithuania
-
 Luxembourg
-
 Madagascar
-
 Malaysia
-
 Malta
Malta
-
 Mauritius
-
 Mexico
-
 Moldova
-
 Mongolia
-
 Montenegro
-
 Morocco
-
 Mozambique
-
 Myanmar
-
 Namibia
-
 Nepal
Nepal
-
 Netherlands
-
 New Zealand
-
 Nigeria
-
 North Macedonia
-
 Norway
-
 Oman
Oman
-
 Pakistan
-
 Palestine
-
 Panama
-
 Papua New Guinea
-
 Paraguay
-
 Peru
Peru
-
 Philippines
-
 Poland
-
 Portugal
-
 Puerto Rico
-
 Qatar
Qatar
-
 Reunion
-
 Romania
-
 Rwanda
-
 Saudi Arabia
-
 Serbia
-
 Singapore
-
 Slovakia
-
 Slovenia
-
 Somalia
-
 South Africa
-
 Spain
Spain
-
 Sri Lanka
-
 Sweden
-
 Switzerland
-
 Syria
Syria
-
 Taiwan
-
 Tajikistan
-
 Tanzania
-
 Thailand
-
 Trinidad and Tobago
-
 Tunisia
-
 Turkey
-
 UAE
UAE
-
 Uganda
-
 Ukraine
-
 United Kingdom
-
United States
-
 Uruguay
-
 Uzbekistan
-
 Venezuela
-
 Vietnam
-
 Yemen
Yemen
-
 Zambia
-
 Zimbabwe
- Forex
- Crypto
Live News
