
NEAR gains 4.87% as RSI turns neutral and key support emerges at $1.10 – weekly review

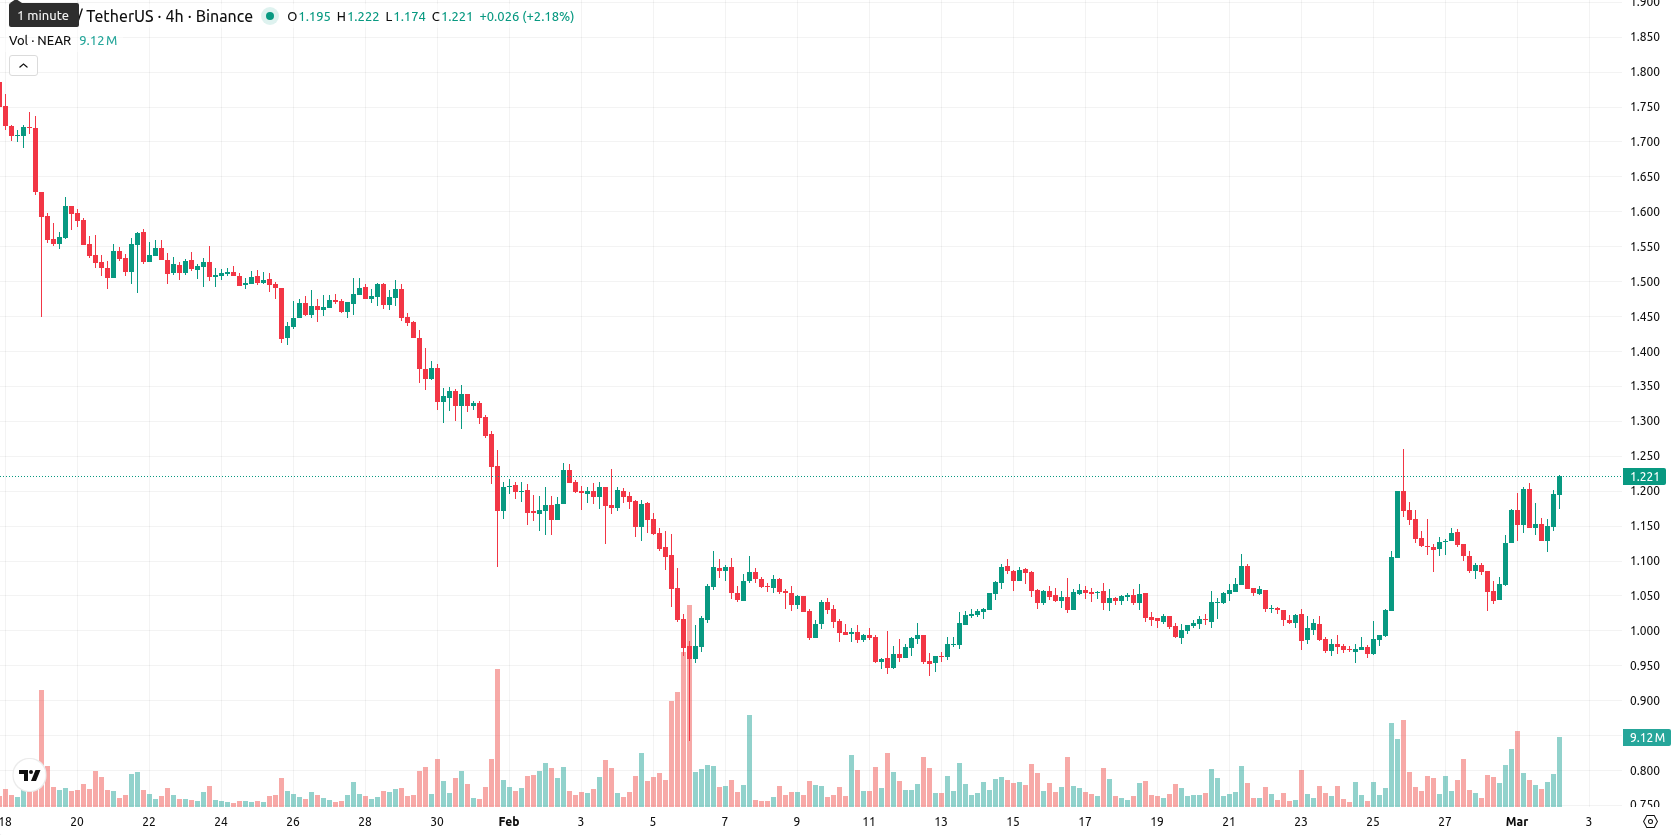
NEAR is trading at $1.2169 after gaining 3.39% over the last week. The asset remains well above its weekly MA-20 at $1.0502, but is still below the MA-50 ($1.2746) and significantly beneath the long-term MA-200 ($2.0075), highlighting a short-term bullish position, while medium- and long-term moving averages exert continued downward pressure.
Highlights
- NEAR is trading at $1.2169, positioned above its MA-20 ($1.0502) but below the MA-50 ($1.2746) and far beneath the MA-200 ($2.0075), suggesting a bullish short-term trend within a bearish medium-term picture.
- Momentum indicators are mixed: MACD shows a strong sell, ADX above 30 indicates a selling environment, while intraday buyer dominance is reflected by positive Bull/Bear Power and the Awesome Oscillator.
- Key levels for the coming week are support at $1.0505 (Ichimoku Kijun), resistance near $1.28 (MA-50), with price expected to consolidate between $1.10 and $1.28.
Mixed momentum signals as resistance caps weekly price gains
On the weekly chart, NEAR’s price is firmly above the MA-20 but continues to face resistance from the MA-50 and MA-200 levels. The Ichimoku Kijun line near $1.0505 provides additional support on W1. Primary weekly support stands at $1.10, with resistance forming around $1.28. Momentum indicators paint a mixed picture: the weekly RSI is neutral at 51.6, and both the Stochastic RSI and Commodity Channel Index point to overbought conditions, suggesting increasing exhaustion risk.
Sideways consolidation expected as breakout chances remain subdued
Looking to the next 5–7 trading days, NEAR is likely to consolidate sideways within a range of $1.10 to $1.28, based on prevailing weekly indicators. The probability of sustained upward movement is low, with less than a 20% chance of a clear breakout above $1.28. If resistance at $1.28 is breached, it could trigger a renewed bullish phase, but a move below $1.10 would signal renewed selling pressure and a potential return to a bearish trend.
Previously it was reported that NEAR Protocol is demonstrating short-term bullish momentum by trading above its 20-day moving average, though it remains below both the 50-day and 200-day averages, signaling ongoing medium- and long-term resistance. Mixed momentum indicators—including a strong selling MACD, high ADX, and overbought oscillators—suggest heightened volatility and active buying interest, yet potential for further upside remains limited by nearby resistance and prevailing longer-term bearish pressures.


Latest NEAR News


-
 Afghanistan
-
 Albania
-
 Algeria
-
 Angola
-
 Argentina
-
 Armenia
-
 Australia
-
 Austria
-
 Azerbaijan
-
 Bahamas
-
 Bahrain
-
 Bangladesh
-
 Belarus
-
 Belgium
-
 Bolivia
-
 Botswana
-
 Brazil
-
 Brunei
-
 Bulgaria
-
 Cambodia
-
 Cameroon
-
 Canada
-
 Chile
Chile
-
 China
China
-
 Colombia
-
 Congo
Congo
-
 Costa Rica
-
 Cote d'Ivoire
-
 Croatia
-
 Cuba
Cuba
-
 Cyprus
-
 Czechia
-
 DR Congo
-
 Denmark
-
 Dominican Republic
-
 Ecuador
-
 Egypt
Egypt
-
 El Salvador
-
 Estonia
-
 Eswatini
-
 Ethiopia
-
 Finland
-
 France
-
 Georgia
-
 Germany
-
 Ghana
Ghana
-
 Greece
-
 Haiti
Haiti
-
 Hong Kong
-
 Hungary
-
 India
India
-
 Indonesia
-
 Iran, Islamic republic
-
 Iraq
Iraq
-
 Ireland
-
 Israel
-
 Italy
Italy
-
 Jamaica
-
 Japan
Japan
-
 Jordan
-
 Kazakhstan
-
 Kenya
Kenya
-
 Korea
Korea
-
 Kuwait
-
 Kyrgyzstan
-
 Laos
Laos
-
 Latvia
-
 Lebanon
-
 Lesotho
-
 Libya
Libya
-
 Lithuania
-
 Luxembourg
-
 Madagascar
-
 Malaysia
-
 Malta
Malta
-
 Mauritius
-
 Mexico
-
 Moldova
-
 Mongolia
-
 Montenegro
-
 Morocco
-
 Mozambique
-
 Myanmar
-
 Namibia
-
 Nepal
Nepal
-
 Netherlands
-
 New Zealand
-
 Nigeria
-
 North Macedonia
-
 Norway
-
 Oman
Oman
-
 Pakistan
-
 Palestine
-
 Panama
-
 Papua New Guinea
-
 Paraguay
-
 Peru
Peru
-
 Philippines
-
 Poland
-
 Portugal
-
 Puerto Rico
-
 Qatar
Qatar
-
 Reunion
-
 Romania
-
 Rwanda
-
 Saudi Arabia
-
 Serbia
-
 Singapore
-
 Slovakia
-
 Slovenia
-
 Somalia
-
 South Africa
-
 Spain
Spain
-
 Sri Lanka
-
 Sweden
-
 Switzerland
-
 Syria
Syria
-
 Taiwan
-
 Tajikistan
-
 Tanzania
-
 Thailand
-
 Trinidad and Tobago
-
 Tunisia
-
 Turkey
-
 UAE
UAE
-
 Uganda
-
 Ukraine
-
 United Kingdom
-
United States
-
 Uruguay
-
 Uzbekistan
-
 Venezuela
-
 Vietnam
-
 Yemen
Yemen
-
 Zambia
-
 Zimbabwe
- Forex
- Crypto
