
Aptos price prediction: Can a capped supply spark a sustained rally? APT climbs 7.5%

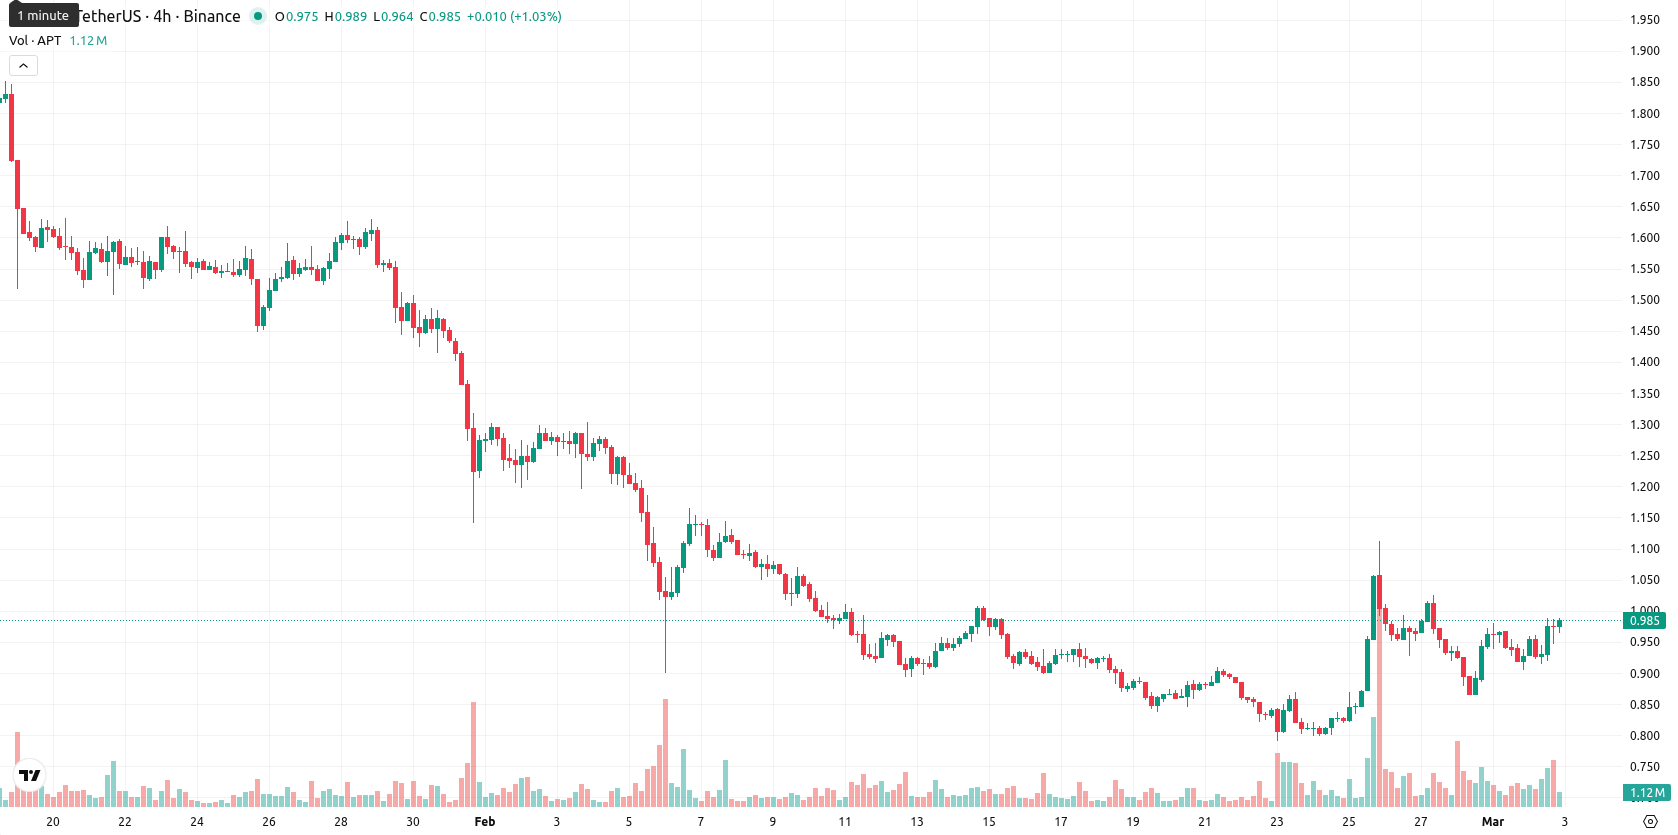
Aptos (APT) is trading at $0.989, positioned above its MA-20 at $0.9167 but still under the MA-50 at $1.2631 and MA-200 at $2.7556. This arrangement signals a degree of short-term bullish momentum for Aptos, though the asset remains under broader selling pressure when viewed through medium- and long-term moving averages, with the Ichimoku Kijun level at $1.0355 acting as immediate resistance.
 0.621
0.6330
0.621
0.6330
Highlights
- Aptos community approved a governance proposal to hard cap total APT supply at 2.1 billion tokens, initiating a shift to deflationary tokenomics.
- New measures will limit inflation by reducing staking rewards, raising gas fees, and using transaction fees for token buybacks to benefit APT holders.
- APT trades at $0.989 with immediate resistance at $1.0355; short-term momentum is bullish, but broader trend indicators signal likely continued weakness.
Deflationary token cap adopted as governance shifts to supply control
The Aptos community has approved a governance proposal to implement a hard cap of 2.1 billion APT tokens, shifting to deflationary tokenomics and capping the previously unlimited supply. This measure will limit inflation by reducing staking rewards, increasing gas fees, and allocating transaction fees for token buybacks to potentially benefit holders. The vote saw overwhelming support, with over 335 million APT in favor and only 1,500 opposed, meeting the minimum participation threshold. These changes are now pending execution.
Mixed momentum signals as firm buyers challenge dominant downtrend
On the technical front, APT trades above the MA-20 but remains under pressure from the MA-50 and MA-200, while the Ichimoku Kijun at $1.0355 sets immediate resistance. Momentum indicators are mixed: both the MACD and ADX reflect strong selling and a dominant downtrend, with the RSI moderately bearish at 41.8. The Stochastic RSI and CCI indicate slight overbought conditions, warranting local caution, while positive Bull/Bear Power highlights active buyers intraday. The Awesome Oscillator remains neutral and does not counteract the short-term bullish move, with a volatile session marked by a 7.5% daily gain closing near highs, demonstrating strength against the broader bearish trend signaled by oscillators and trend measures.
Limited breakout odds as long-term indicators point to sideways trade
Looking ahead to the next five trading days, APT is likely to consolidate within a $0.89 – $1.09 volatility band relative to current levels. There is a low chance, less than 20%, of a sustained upside breakout, as weekly signals from the MACD, RSI, ADX, and long-term moving averages indicate prevailing weakness. The base case is continued sideways trading within this corridor. A bullish scenario would require a clear move above the immediate $1.04 resistance, while a break below $0.89 could trigger further downside.
Last time, analysts noted that Aptos is trading narrowly above its short-term moving average but remains well below its longer-term moving averages, confirming a sustained bearish trend with minimal support from technical indicators. Persistent downside momentum is reinforced by negative MACD, ADX, and RSI readings, with price action expected to remain range-bound between $0.83 and $1.00 unless a breakout above $1.0355 occurs.








-
 Afghanistan
-
 Albania
-
 Algeria
-
 Angola
-
 Argentina
-
 Armenia
-
 Australia
-
 Austria
-
 Azerbaijan
-
 Bahamas
-
 Bahrain
-
 Bangladesh
-
 Belarus
-
 Belgium
-
 Bolivia
-
 Botswana
-
 Brazil
-
 Brunei
-
 Bulgaria
-
 Cambodia
-
 Cameroon
-
 Canada
-
 Chile
Chile
-
 China
China
-
 Colombia
-
 Congo
Congo
-
 Costa Rica
-
 Cote d'Ivoire
-
 Croatia
-
 Cuba
Cuba
-
 Cyprus
-
 Czechia
-
 DR Congo
-
 Denmark
-
 Dominican Republic
-
 Ecuador
-
 Egypt
Egypt
-
 El Salvador
-
 Estonia
-
 Eswatini
-
 Ethiopia
-
 Finland
-
 France
-
 Georgia
-
 Germany
-
 Ghana
Ghana
-
 Greece
-
 Haiti
Haiti
-
 Hong Kong
-
 Hungary
-
 India
India
-
 Indonesia
-
 Iran, Islamic republic
-
 Iraq
Iraq
-
 Ireland
-
 Israel
-
 Italy
Italy
-
 Jamaica
-
 Japan
Japan
-
 Jordan
-
 Kazakhstan
-
 Kenya
Kenya
-
 Korea
Korea
-
 Kuwait
-
 Kyrgyzstan
-
 Laos
Laos
-
 Latvia
-
 Lebanon
-
 Lesotho
-
 Libya
Libya
-
 Lithuania
-
 Luxembourg
-
 Madagascar
-
 Malaysia
-
 Malta
Malta
-
 Mauritius
-
 Mexico
-
 Moldova
-
 Mongolia
-
 Montenegro
-
 Morocco
-
 Mozambique
-
 Myanmar
-
 Namibia
-
 Nepal
Nepal
-
 Netherlands
-
 New Zealand
-
 Nigeria
-
 North Macedonia
-
 Norway
-
 Oman
Oman
-
 Pakistan
-
 Palestine
-
 Panama
-
 Papua New Guinea
-
 Paraguay
-
 Peru
Peru
-
 Philippines
-
 Poland
-
 Portugal
-
 Puerto Rico
-
 Qatar
Qatar
-
 Reunion
-
 Romania
-
 Rwanda
-
 Saudi Arabia
-
 Serbia
-
 Singapore
-
 Slovakia
-
 Slovenia
-
 Somalia
-
 South Africa
-
 Spain
Spain
-
 Sri Lanka
-
 Sweden
-
 Switzerland
-
 Syria
Syria
-
 Taiwan
-
 Tajikistan
-
 Tanzania
-
 Thailand
-
 Trinidad and Tobago
-
 Tunisia
-
 Turkey
-
 UAE
UAE
-
 Uganda
-
 Ukraine
-
 United Kingdom
-
United States
-
 Uruguay
-
 Uzbekistan
-
 Venezuela
-
 Vietnam
-
 Yemen
Yemen
-
 Zambia
-
 Zimbabwe
- Forex
- Crypto












