
-7.54% for NEAR — Bearish trend persists amid volatile consolidation range

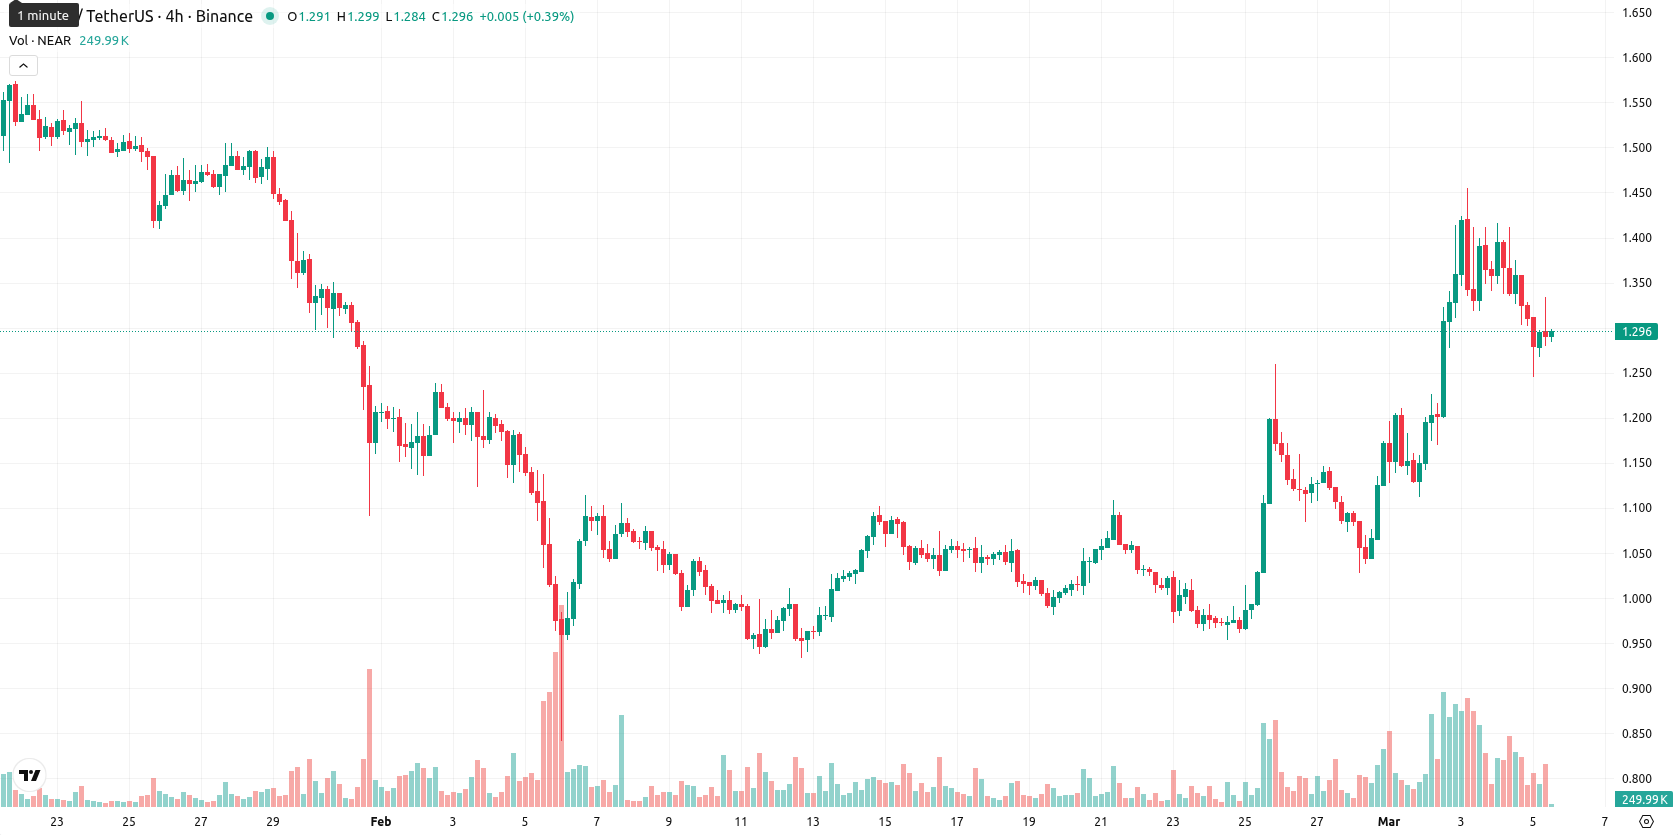
NEAR (NEAR) is trading at $1.3018, down 7.54% for the day. The current price remains above the MA-20 ($1.1058) and MA-50 ($1.2505) but below the MA-200 ($1.9866), indicating short-to-medium term strength but sustained long-term selling pressure.
Highlights
- NEAR trades above short- and medium-term moving averages, signaling ongoing bullish momentum despite long-term bearish pressure.
- Overbought indicator readings contrast with neutral momentum, raising near-term pullback risks amid high intraday volatility.
- Expected five-session range is $1.19–$1.42, with a bearish bias and under 20% probability of a breakout higher.
Buyer dominance faces pullback risks amid mixed signals
Momentum indicators for NEAR present a mixed view: the ADX is solidly positive, confirming trending conditions, while the MACD on the daily timeframe is neutral. RSI stands at 60 with a Buy signal, and the Bull/Bear Power indicator is positive, indicating slight intraday buyer dominance. However, overbought signals from the Stochastic RSI and Commodity Channel Index suggest the risk of near-term pullbacks. The Ichimoku Kijun at $1.1945 acts as immediate support, while today’s high volatility and wide intraday range highlight ongoing downside tone from early selling pressure.
Sideways consolidation favored as upside probabilities weaken
In the near term, NEAR’s price is expected to consolidate within a typical volatility band between $1.19 and $1.42. The likelihood of a further upward move is estimated below 20%, making a downward move more probable. Baseline outlook calls for sideways action between immediate support and resistance, with bullish continuation requiring a break above $1.42 and a bearish scenario potentially testing support near $1.19 or lower. Weekly momentum and long-term moving averages remain bearish, favoring corrective or sideways activity unless sustained buying emerges.
Last time, analysts noted that NEAR Protocol is exhibiting strong short- and medium-term bullish momentum, with the price trading above its 20- and 50-day moving averages but still facing long-term resistance below the 200-day average. Momentum indicators are mixed—ADX shows a strong trend while MACD is neutral, and despite rising RSI and buyer strength, overbought signals on Stochastic RSI and CCI suggest heightened volatility and potential for short-term profit-taking.


Latest NEAR News


-
 Afghanistan
-
 Albania
-
 Algeria
-
 Angola
-
 Argentina
-
 Armenia
-
 Australia
-
 Austria
-
 Azerbaijan
-
 Bahamas
-
 Bahrain
-
 Bangladesh
-
 Belarus
-
 Belgium
-
 Bolivia
-
 Botswana
-
 Brazil
-
 Brunei
-
 Bulgaria
-
 Cambodia
-
 Cameroon
-
 Canada
-
 Chile
Chile
-
 China
China
-
 Colombia
-
 Congo
Congo
-
 Costa Rica
-
 Cote d'Ivoire
-
 Croatia
-
 Cuba
Cuba
-
 Cyprus
-
 Czechia
-
 DR Congo
-
 Denmark
-
 Dominican Republic
-
 Ecuador
-
 Egypt
Egypt
-
 El Salvador
-
 Estonia
-
 Eswatini
-
 Ethiopia
-
 Finland
-
 France
-
 Georgia
-
 Germany
-
 Ghana
Ghana
-
 Greece
-
 Haiti
Haiti
-
 Hong Kong
-
 Hungary
-
 India
India
-
 Indonesia
-
 Iran, Islamic republic
-
 Iraq
Iraq
-
 Ireland
-
 Israel
-
 Italy
Italy
-
 Jamaica
-
 Japan
Japan
-
 Jordan
-
 Kazakhstan
-
 Kenya
Kenya
-
 Korea
Korea
-
 Kuwait
-
 Kyrgyzstan
-
 Laos
Laos
-
 Latvia
-
 Lebanon
-
 Lesotho
-
 Libya
Libya
-
 Lithuania
-
 Luxembourg
-
 Madagascar
-
 Malaysia
-
 Malta
Malta
-
 Mauritius
-
 Mexico
-
 Moldova
-
 Mongolia
-
 Montenegro
-
 Morocco
-
 Mozambique
-
 Myanmar
-
 Namibia
-
 Nepal
Nepal
-
 Netherlands
-
 New Zealand
-
 Nigeria
-
 North Macedonia
-
 Norway
-
 Oman
Oman
-
 Pakistan
-
 Palestine
-
 Panama
-
 Papua New Guinea
-
 Paraguay
-
 Peru
Peru
-
 Philippines
-
 Poland
-
 Portugal
-
 Puerto Rico
-
 Qatar
Qatar
-
 Reunion
-
 Romania
-
 Rwanda
-
 Saudi Arabia
-
 Serbia
-
 Singapore
-
 Slovakia
-
 Slovenia
-
 Somalia
-
 South Africa
-
 Spain
Spain
-
 Sri Lanka
-
 Sweden
-
 Switzerland
-
 Syria
Syria
-
 Taiwan
-
 Tajikistan
-
 Tanzania
-
 Thailand
-
 Trinidad and Tobago
-
 Tunisia
-
 Turkey
-
 UAE
UAE
-
 Uganda
-
 Ukraine
-
 United Kingdom
-
United States
-
 Uruguay
-
 Uzbekistan
-
 Venezuela
-
 Vietnam
-
 Yemen
Yemen
-
 Zambia
-
 Zimbabwe
- Forex
- Crypto
