
The Graph price prediction: Sideways trend expected as GRT gains 7.20%

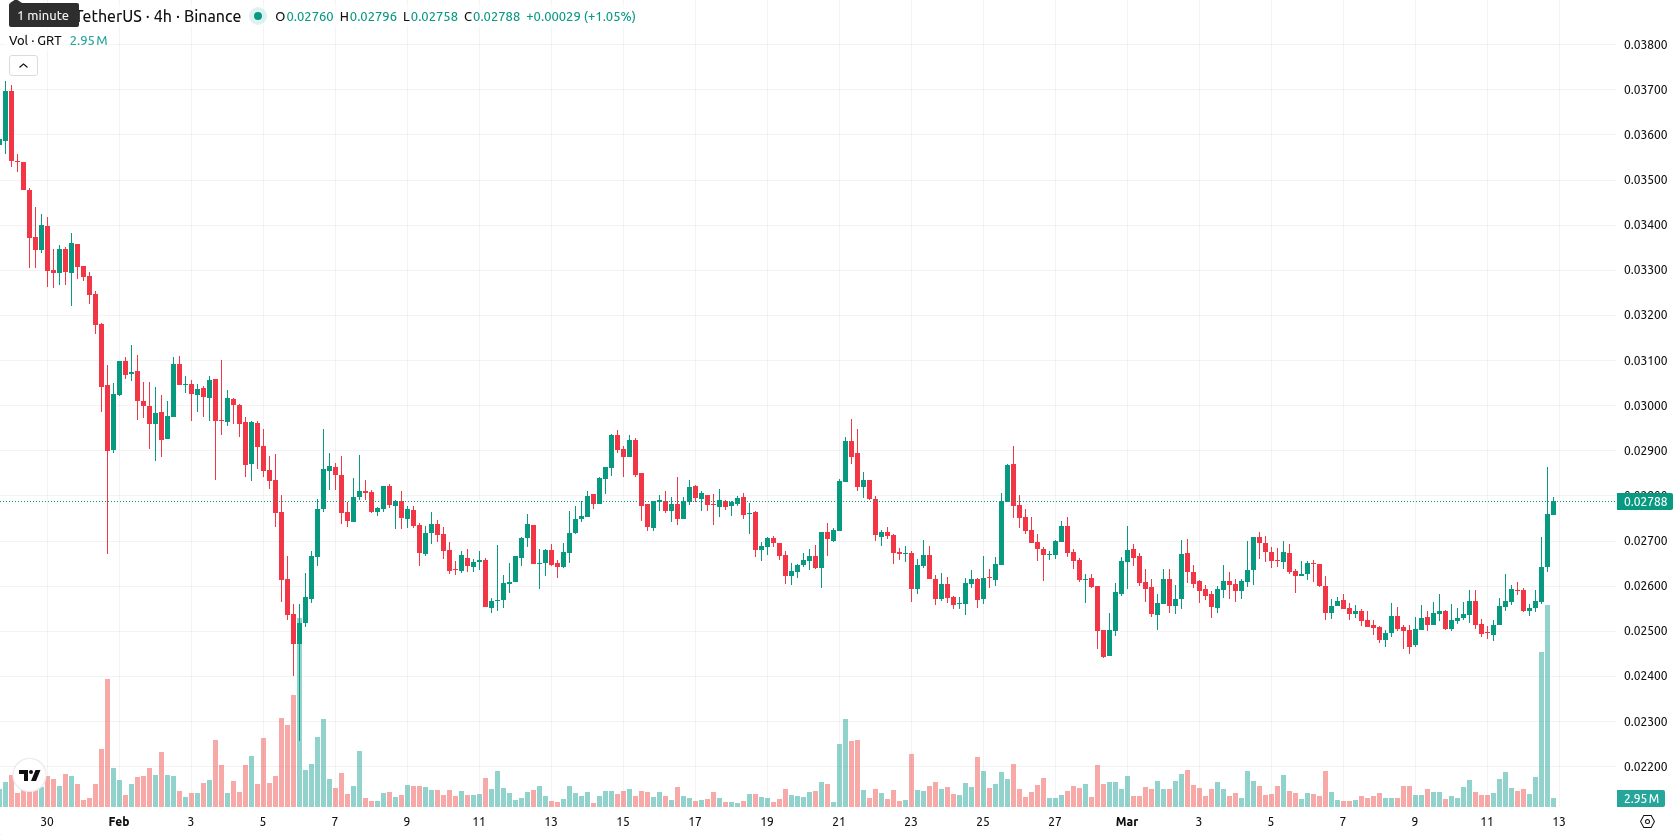
The Graph (GRT) is trading at $0.027754 after a daily gain of 7.20%. The price is above the SMA-20 ($0.026148), but remains below the SMA-50 ($0.028794) and well below the SMA-200 ($0.054105), pointing to short-term recovery while medium- and long-term pressure persists.
 0.01637
0.01697000
0.01637
0.01697000
Highlights
- GRT trades with short-term upside momentum but remains below key medium- and long-term moving averages, reflecting ongoing bearish pressure.
- Mixed technical signals dominate, as daily and weekly momentum indicators point to trend exhaustion and high risk of near-term reversal.
- Price is expected to trade sideways between $0.025 and $0.029 over the next week, with resistance at $0.0282 and support at $0.0253.
Mixed momentum and high volatility as oscillators warn of exhaustion
Momentum signals are mixed: daily MACD and ADX both signal a weakening trend, while oscillators such as RSI (45.38, “Sell”), CCI (-55.92, “Sell”), and Stoch RSI (“Overbought”) indicate there is no strong buying interest and risk of near-term exhaustion is rising. However, BBP points to continued buyer dominance, and AO remains negative, supporting the underlying bearish bias. The Ichimoku Kijun at $0.027040 sits just below the current price and acts as immediate support. Today’s session opened with no notable gap and is now pushing near the intraday high after a steep 7.20% rise, showing high volatility and strength toward the highs, even as some intraday indicators diverge from the daily momentum outlook.
Limited upside as risk tilts toward range-bound or lower moves
Over the next 5 trading days, GRT is expected to trade within a typical volatility band of $0.025 to $0.029, consistent with current market dynamics. The probability of further price increases in the short term is very low (less than 20%), with a decrease more likely based on prevailing 'Sell' signals from the weekly RSI, ADX, MACD, and moving averages. The baseline scenario is sideways trading within this corridor. A breakout above $0.0282 would open up a bullish scenario, while a drop below $0.0253 would indicate renewed selling momentum.
Last time, analysts noted that The Graph showed a modest recovery but remained entrenched in bearish territory, trading well below all major moving averages with no strong support and persistent downside signals confirmed by technical indicators including MACD, RSI, Stochastic RSI, and CCI. Despite heightened volatility, the asset is expected to remain rangebound between nearby support and resistance, with a low probability of breakout and no indications of bullish momentum.









-
 Afghanistan
-
 Albania
-
 Algeria
-
 Angola
-
 Argentina
-
 Armenia
-
 Australia
-
 Austria
-
 Azerbaijan
-
 Bahamas
-
 Bahrain
-
 Bangladesh
-
 Belarus
-
 Belgium
-
 Bolivia
-
 Botswana
-
 Brazil
-
 Brunei
-
 Bulgaria
-
 Cambodia
-
 Cameroon
-
 Canada
-
 Chile
Chile
-
 China
China
-
 Colombia
-
 Congo
Congo
-
 Costa Rica
-
 Cote d'Ivoire
-
 Croatia
-
 Cuba
Cuba
-
 Cyprus
-
 Czechia
-
 DR Congo
-
 Denmark
-
 Dominican Republic
-
 Ecuador
-
 Egypt
Egypt
-
 El Salvador
-
 Estonia
-
 Eswatini
-
 Ethiopia
-
 Finland
-
 France
-
 Georgia
-
 Germany
-
 Ghana
Ghana
-
 Greece
-
 Haiti
Haiti
-
 Hong Kong
-
 Hungary
-
 India
India
-
 Indonesia
-
 Iran, Islamic republic
-
 Iraq
Iraq
-
 Ireland
-
 Israel
-
 Italy
Italy
-
 Jamaica
-
 Japan
Japan
-
 Jordan
-
 Kazakhstan
-
 Kenya
Kenya
-
 Korea
Korea
-
 Kuwait
-
 Kyrgyzstan
-
 Laos
Laos
-
 Latvia
-
 Lebanon
-
 Lesotho
-
 Libya
Libya
-
 Lithuania
-
 Luxembourg
-
 Madagascar
-
 Malaysia
-
 Malta
Malta
-
 Mauritius
-
 Mexico
-
 Moldova
-
 Mongolia
-
 Montenegro
-
 Morocco
-
 Mozambique
-
 Myanmar
-
 Namibia
-
 Nepal
Nepal
-
 Netherlands
-
 New Zealand
-
 Nigeria
-
 North Macedonia
-
 Norway
-
 Oman
Oman
-
 Pakistan
-
 Palestine
-
 Panama
-
 Papua New Guinea
-
 Paraguay
-
 Peru
Peru
-
 Philippines
-
 Poland
-
 Portugal
-
 Puerto Rico
-
 Qatar
Qatar
-
 Reunion
-
 Romania
-
 Rwanda
-
 Saudi Arabia
-
 Serbia
-
 Singapore
-
 Slovakia
-
 Slovenia
-
 Somalia
-
 South Africa
-
 Spain
Spain
-
 Sri Lanka
-
 Sweden
-
 Switzerland
-
 Syria
Syria
-
 Taiwan
-
 Tajikistan
-
 Tanzania
-
 Thailand
-
 Trinidad and Tobago
-
 Tunisia
-
 Turkey
-
 UAE
UAE
-
 Uganda
-
 Ukraine
-
 United Kingdom
-
United States
-
 Uruguay
-
 Uzbekistan
-
 Venezuela
-
 Vietnam
-
 Yemen
Yemen
-
 Zambia
-
 Zimbabwe
- Forex
- Crypto












