
Bittensor price prediction: Overbought risk after rally? TAO jumps 11.76%

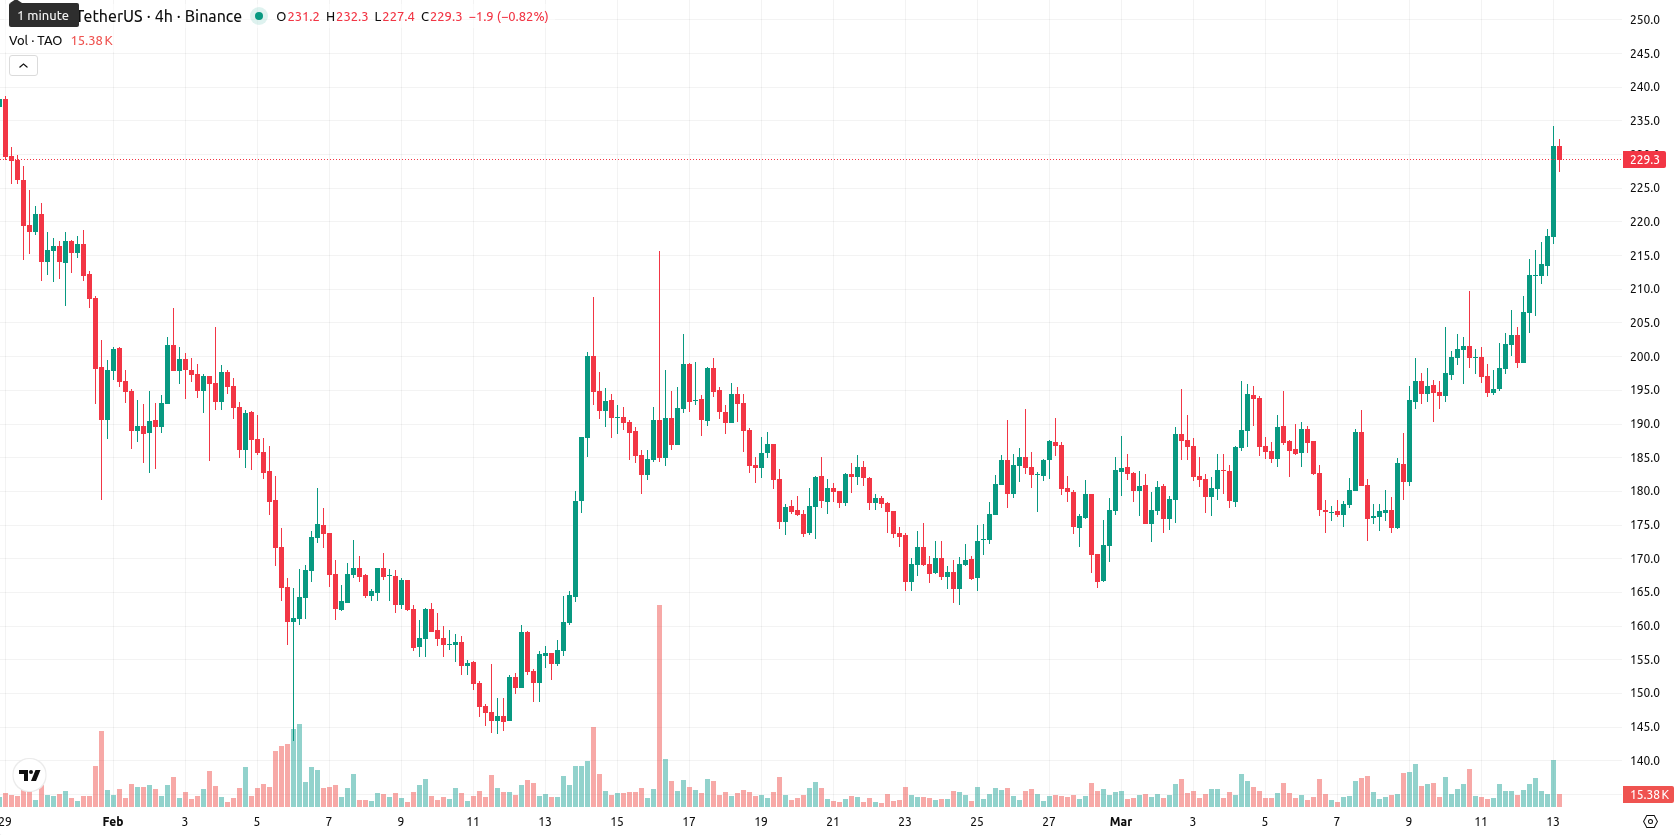
Bittensor (TAO) is trading at $229.90 after a sharp daily increase of 11.76%, maintaining a strong position well above its SMA-20 and SMA-50 but still below the SMA-200, signaling strong near-term bullish momentum amid ongoing long-term weakness.
Highlights
- Bittensor advanced its ecosystem with the Dynamic TAO upgrade, introducing subnet-specific tokens and validator liquidity pools in February 2025.
- A $5 million funding round and Grayscale Trust’s move toward ETF-style NYSE Arca listing signal growing institutional engagement.
- TAO trades near $229.90 in a bullish but overbought pattern, with expected consolidation between $207 and $250 amid heightened volatility.
Protocol upgrade and ETF plans drive institutional support expansion
Bittensor recently completed a major protocol upgrade with the launch of the Dynamic TAO (dTAO) system in February 2025, pairing each subnet with its own token and introducing liquidity pools for validators staking TAO. The network also saw a $5 million funding round to support infrastructure development, reflecting continued institutional backing. Additional developments include Grayscale Bittensor Trust switching to the CoinDesk Bittensor Benchmark Rate for pricing in March 2026 and filing for a potential NYSE Arca listing with an ETF-style structure, though approval is pending.
Short-term breakout risk rises as momentum diverges from trend depth
TAO trades significantly above its SMA-20 ($184.08) and SMA-50 ($190.01) but remains below the SMA-200 ($287.08), underscoring pronounced short- and medium-term strength even as the long-term trend remains unresolved. The Ichimoku Kijun at $190.70 provides key support beneath the current price. Momentum indicators (MACD, AO) confirm the bullish shift, but the ADX reads neutral, suggesting the uptrend is not highly established; meanwhile, overbought signals are apparent from the RSI (64.3), Stoch RSI (100), CCI (232.79), and BBP (26.84), indicating heightened buyer dominance and a stretched move. Today’s action features a notable intraday rally as price gaps higher from the open and holds close to session highs, with oscillators cautioning of potential pullback risk despite strong momentum.
Consolidation favored as resistance limits further upside potential
Over the next five trading days, TAO is expected to trade within a typical volatility band from $207.00 to $250.00. With much of the weekly indicator set (RSI, MACD, MA-50) showing bearish or neutral signals, the likelihood of a continued upward move is low (less than 20%), positioning a consolidation or pullback scenario as more probable. Upside follow-through would require a decisive break above resistance at $233.50, while a downside move below $216.70 could trigger a deeper correction.
Last time, analysts noted that Bittensor (TAO) sustained robust short- and medium-term momentum, holding well above its 20- and 50-day moving averages but still facing resistance below the longer-term 200-day average. Current momentum indicators, such as the MACD and AO, support the uptrend, though multiple oscillators warn of overbought conditions and elevated volatility, signaling a risk of near-term consolidation or pullback unless a breakout occurs.


-
 Afghanistan
-
 Albania
-
 Algeria
-
 Angola
-
 Argentina
-
 Armenia
-
 Australia
-
 Austria
-
 Azerbaijan
-
 Bahamas
-
 Bahrain
-
 Bangladesh
-
 Belarus
-
 Belgium
-
 Bolivia
-
 Botswana
-
 Brazil
-
 Brunei
-
 Bulgaria
-
 Cambodia
-
 Cameroon
-
 Canada
-
 Chile
Chile
-
 China
China
-
 Colombia
-
 Congo
Congo
-
 Costa Rica
-
 Cote d'Ivoire
-
 Croatia
-
 Cuba
Cuba
-
 Cyprus
-
 Czechia
-
 DR Congo
-
 Denmark
-
 Dominican Republic
-
 Ecuador
-
 Egypt
Egypt
-
 El Salvador
-
 Estonia
-
 Eswatini
-
 Ethiopia
-
 Finland
-
 France
-
 Georgia
-
 Germany
-
 Ghana
Ghana
-
 Greece
-
 Haiti
Haiti
-
 Hong Kong
-
 Hungary
-
 India
India
-
 Indonesia
-
 Iran, Islamic republic
-
 Iraq
Iraq
-
 Ireland
-
 Israel
-
 Italy
Italy
-
 Jamaica
-
 Japan
Japan
-
 Jordan
-
 Kazakhstan
-
 Kenya
Kenya
-
 Korea
Korea
-
 Kuwait
-
 Kyrgyzstan
-
 Laos
Laos
-
 Latvia
-
 Lebanon
-
 Lesotho
-
 Libya
Libya
-
 Lithuania
-
 Luxembourg
-
 Madagascar
-
 Malaysia
-
 Malta
Malta
-
 Mauritius
-
 Mexico
-
 Moldova
-
 Mongolia
-
 Montenegro
-
 Morocco
-
 Mozambique
-
 Myanmar
-
 Namibia
-
 Nepal
Nepal
-
 Netherlands
-
 New Zealand
-
 Nigeria
-
 North Macedonia
-
 Norway
-
 Oman
Oman
-
 Pakistan
-
 Palestine
-
 Panama
-
 Papua New Guinea
-
 Paraguay
-
 Peru
Peru
-
 Philippines
-
 Poland
-
 Portugal
-
 Puerto Rico
-
 Qatar
Qatar
-
 Reunion
-
 Romania
-
 Rwanda
-
 Saudi Arabia
-
 Serbia
-
 Singapore
-
 Slovakia
-
 Slovenia
-
 Somalia
-
 South Africa
-
 Spain
Spain
-
 Sri Lanka
-
 Sweden
-
 Switzerland
-
 Syria
Syria
-
 Taiwan
-
 Tajikistan
-
 Tanzania
-
 Thailand
-
 Trinidad and Tobago
-
 Tunisia
-
 Turkey
-
 UAE
UAE
-
 Uganda
-
 Ukraine
-
 United Kingdom
-
United States
-
 Uruguay
-
 Uzbekistan
-
 Venezuela
-
 Vietnam
-
 Yemen
Yemen
-
 Zambia
-
 Zimbabwe
- Forex
- Crypto
