
ApeCoin price prediction: Can resistance hold? APE gains 7.15% in volatile trade

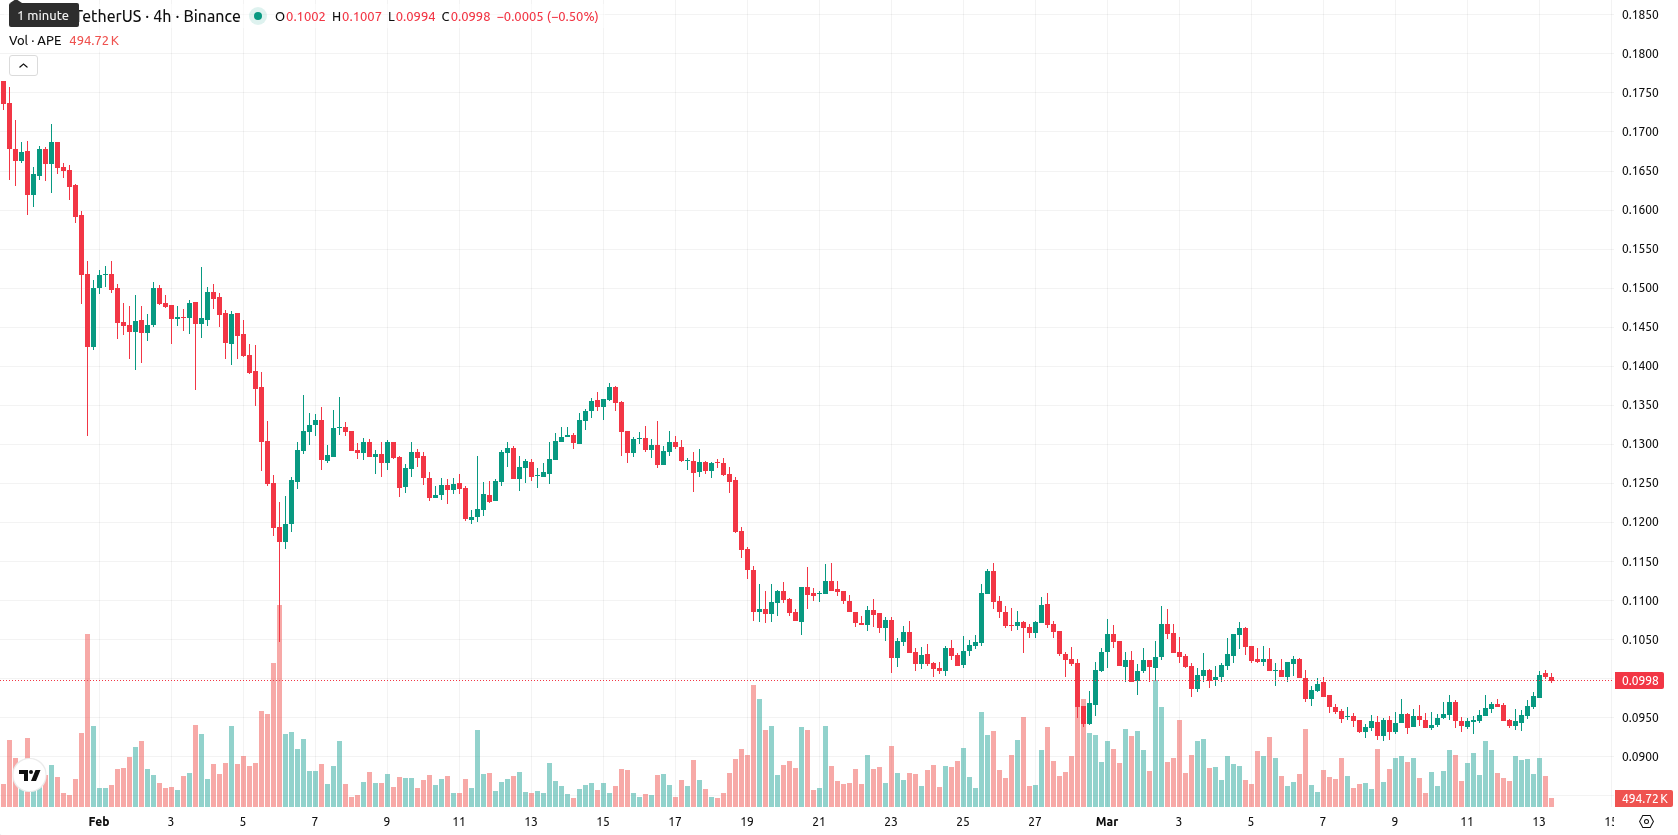
ApeCoin (APE) is trading at $0.1004 after climbing 7.15% on the day, placing the asset just below the SMA-20 ($0.10098) and well beneath the SMA-50 ($0.12761) and SMA-200 ($0.31582). Persistent medium- and long-term selling pressure prevails, despite a short-term momentum rebound, with the Ichimoku Kijun at $0.11490 serving as immediate resistance.
Highlights
- APE remains under persistent selling pressure, trading below key moving averages and failing to reclaim medium- or long-term momentum.
- Bearish momentum dominates as most technical indicators point down, with rallies sold into despite occasional intraday rebounds.
- APE is likely to move sideways between $0.090 and $0.110, with limited upside potential and increased risk of further declines if support fails.
Weak momentum persists as oscillators remain in conflict
Momentum remains weak overall for APE. MACD signals a strong sell, while ADX on the daily chart indicates a robust bearish trend. Stoch RSI points to overbought conditions; however, both the RSI and CCI remain in oversold territory. BBP is slightly negative, highlighting ongoing seller dominance within the session despite today's advance. The price is near today's high with moderate volatility, and although several oscillators send conflicting signals, price action leans toward session highs while medium-term indicators continue to show weakness.
Downside risk prevails as technicals reaffirm bearish stance
Over the next five days, the expected price band for APE is $0.090–$0.110, reflecting a typical volatility band relative to current levels. The probability of further price increases is low (less than 20%), while declines are much more likely as weekly technical indicators — including RSI, ADX, MACD, and the MA-50 — remain bearish. The baseline scenario is continued sideways movement between $0.090 and $0.110. A bullish setup would require a breakout above $0.11490, which is unlikely given prevailing resistance and suppressed momentum; conversely, a bearish scenario could see price drop below $0.090 if sellers regain control.
Previously it was reported that ApeCoin is trading below key moving averages, with momentum indicators like MACD and ADX confirming strong bearish sentiment and oscillators such as RSI and Stochastic RSI highlighting persistent oversold conditions. Immediate resistance remains capped near $0.1221, and continued weak momentum signals suggest consolidation within a limited range, with a high probability of further downside barring a decisive upside breakout.


-
 Afghanistan
-
 Albania
-
 Algeria
-
 Angola
-
 Argentina
-
 Armenia
-
 Australia
-
 Austria
-
 Azerbaijan
-
 Bahamas
-
 Bahrain
-
 Bangladesh
-
 Belarus
-
 Belgium
-
 Bolivia
-
 Botswana
-
 Brazil
-
 Brunei
-
 Bulgaria
-
 Cambodia
-
 Cameroon
-
 Canada
-
 Chile
Chile
-
 China
China
-
 Colombia
-
 Congo
Congo
-
 Costa Rica
-
 Cote d'Ivoire
-
 Croatia
-
 Cuba
Cuba
-
 Cyprus
-
 Czechia
-
 DR Congo
-
 Denmark
-
 Dominican Republic
-
 Ecuador
-
 Egypt
Egypt
-
 El Salvador
-
 Estonia
-
 Eswatini
-
 Ethiopia
-
 Finland
-
 France
-
 Georgia
-
 Germany
-
 Ghana
Ghana
-
 Greece
-
 Haiti
Haiti
-
 Hong Kong
-
 Hungary
-
 India
India
-
 Indonesia
-
 Iran, Islamic republic
-
 Iraq
Iraq
-
 Ireland
-
 Israel
-
 Italy
Italy
-
 Jamaica
-
 Japan
Japan
-
 Jordan
-
 Kazakhstan
-
 Kenya
Kenya
-
 Korea
Korea
-
 Kuwait
-
 Kyrgyzstan
-
 Laos
Laos
-
 Latvia
-
 Lebanon
-
 Lesotho
-
 Libya
Libya
-
 Lithuania
-
 Luxembourg
-
 Madagascar
-
 Malaysia
-
 Malta
Malta
-
 Mauritius
-
 Mexico
-
 Moldova
-
 Mongolia
-
 Montenegro
-
 Morocco
-
 Mozambique
-
 Myanmar
-
 Namibia
-
 Nepal
Nepal
-
 Netherlands
-
 New Zealand
-
 Nigeria
-
 North Macedonia
-
 Norway
-
 Oman
Oman
-
 Pakistan
-
 Palestine
-
 Panama
-
 Papua New Guinea
-
 Paraguay
-
 Peru
Peru
-
 Philippines
-
 Poland
-
 Portugal
-
 Puerto Rico
-
 Qatar
Qatar
-
 Reunion
-
 Romania
-
 Rwanda
-
 Saudi Arabia
-
 Serbia
-
 Singapore
-
 Slovakia
-
 Slovenia
-
 Somalia
-
 South Africa
-
 Spain
Spain
-
 Sri Lanka
-
 Sweden
-
 Switzerland
-
 Syria
Syria
-
 Taiwan
-
 Tajikistan
-
 Tanzania
-
 Thailand
-
 Trinidad and Tobago
-
 Tunisia
-
 Turkey
-
 UAE
UAE
-
 Uganda
-
 Ukraine
-
 United Kingdom
-
United States
-
 Uruguay
-
 Uzbekistan
-
 Venezuela
-
 Vietnam
-
 Yemen
Yemen
-
 Zambia
-
 Zimbabwe
- Forex
- Crypto
