
ApeCoin price prediction: More downside ahead? APE bounces 7.00% but risks remain

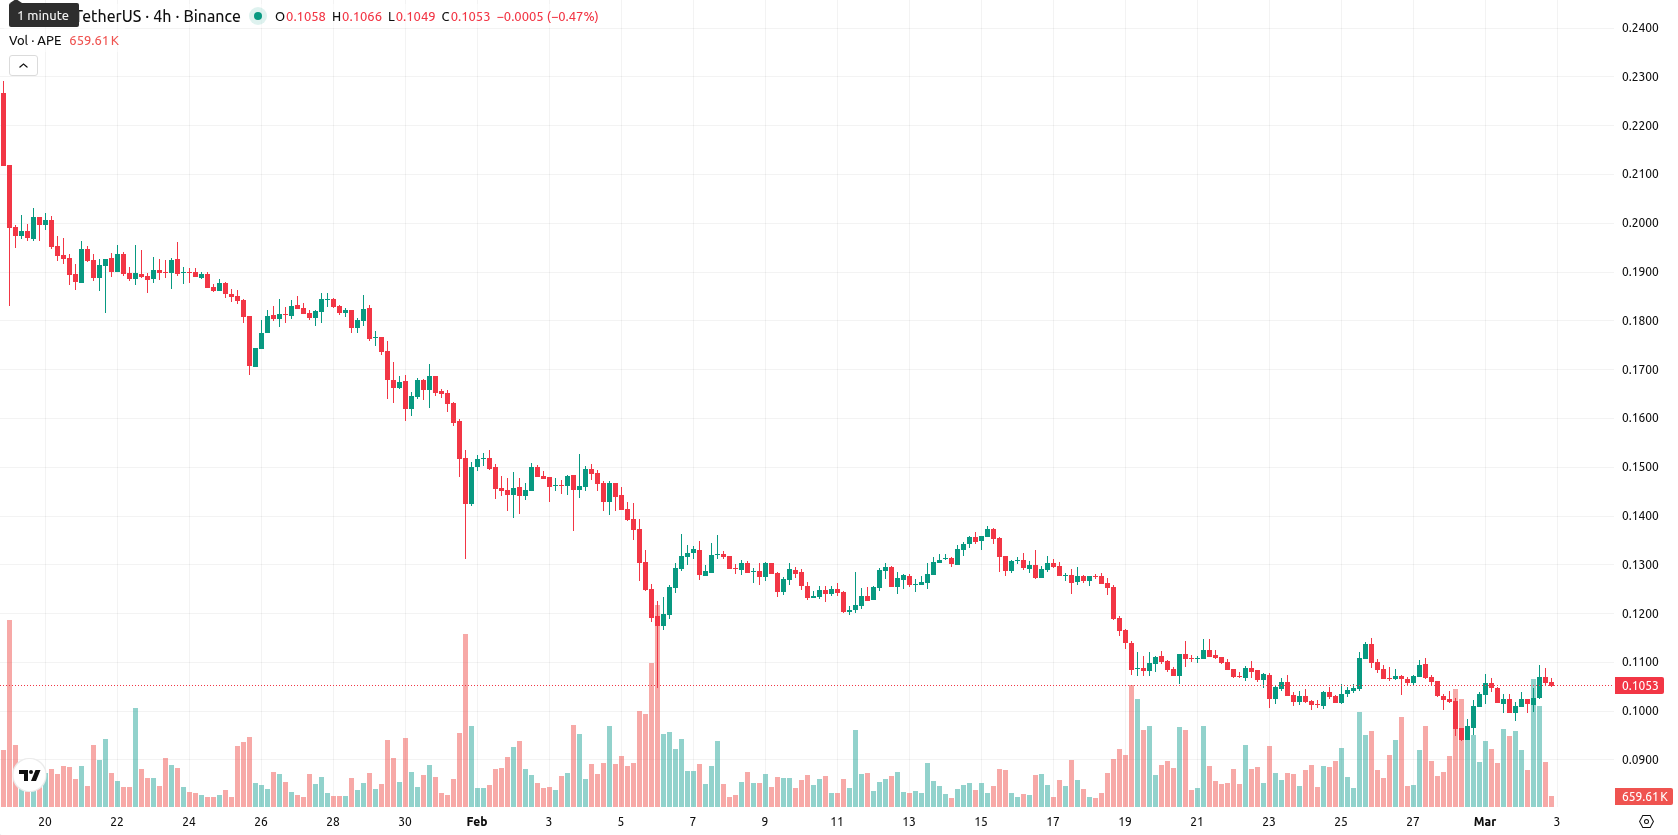
ApeCoin (APE) is trading at $0.1055, up 7.00% for the day and positioned below its MA-20 ($0.1155), MA-50 ($0.1525), and MA-200 ($0.3442) — underscoring persistent selling pressure across all trend horizons. The Ichimoku Kijun indicator sets the nearest resistance at $0.1221, with price action recovering into the middle of today's $0.0995 – $0.1092 intraday range.
Highlights
- APE trades at $0.1055, remaining below MA-20 ($0.1155), MA-50 ($0.1525), and MA-200 ($0.3442), signaling persistent multi-timeframe selling pressure.
- Daily technical indicators—MACD, ADX, and CCI—show strong bearish momentum, while RSI (29) and Stochastic RSI indicate deeply oversold conditions.
- APE is expected to consolidate between $0.095 and $0.115 over the next five sessions, with an 80%+ probability of further downside unless $0.122 resistance is breached.
Bearish bias holds as oscillators confirm weak recovery momentum
Momentum indicators on the daily chart reveal strong bearish momentum for APE as signaled by both MACD and ADX readings. RSI sits deep in oversold territory at 29, and Stochastic RSI reinforces this condition, supported by the Commodity Channel Index in sell range and slightly negative Bull/Bear Power indicating sellers remain dominant intraday. The price recovery today presents a near-term bounce, but weak underlying trend momentum and neutral-to-oversold oscillators suggest only tentative stabilization rather than a robust turnaround.
Sideways trading likely as continued sell signals cap upside
Over the next five sessions, APE is expected to fluctuate within a typical volatility band, ranging from $0.095 to $0.115. There is an over 80% probability of further price decrease based on prevailing daily and weekly sell signals. The baseline scenario is for the price to consolidate sideways within this range. A bullish scenario would require a breakout above $0.122 to initiate short covering, while a move below $0.099 would likely lead to new lows as sellers maintain control.
Previously it was reported that ApeCoin is trading under persistent bearish pressure, staying below major moving averages with momentum indicators such as MACD and ADX confirming a continued downtrend, while oscillators display mixed signals amid oversold conditions. Further downside appears likely, with immediate resistance at $0.1231 and a key support level at $0.0919, as the probability of a bullish reversal in the short term remains low.


-
 Afghanistan
-
 Albania
-
 Algeria
-
 Angola
-
 Argentina
-
 Armenia
-
 Australia
-
 Austria
-
 Azerbaijan
-
 Bahamas
-
 Bahrain
-
 Bangladesh
-
 Belarus
-
 Belgium
-
 Bolivia
-
 Botswana
-
 Brazil
-
 Brunei
-
 Bulgaria
-
 Cambodia
-
 Cameroon
-
 Canada
-
 Chile
Chile
-
 China
China
-
 Colombia
-
 Congo
Congo
-
 Costa Rica
-
 Cote d'Ivoire
-
 Croatia
-
 Cuba
Cuba
-
 Cyprus
-
 Czechia
-
 DR Congo
-
 Denmark
-
 Dominican Republic
-
 Ecuador
-
 Egypt
Egypt
-
 El Salvador
-
 Estonia
-
 Eswatini
-
 Ethiopia
-
 Finland
-
 France
-
 Georgia
-
 Germany
-
 Ghana
Ghana
-
 Greece
-
 Haiti
Haiti
-
 Hong Kong
-
 Hungary
-
 India
India
-
 Indonesia
-
 Iran, Islamic republic
-
 Iraq
Iraq
-
 Ireland
-
 Israel
-
 Italy
Italy
-
 Jamaica
-
 Japan
Japan
-
 Jordan
-
 Kazakhstan
-
 Kenya
Kenya
-
 Korea
Korea
-
 Kuwait
-
 Kyrgyzstan
-
 Laos
Laos
-
 Latvia
-
 Lebanon
-
 Lesotho
-
 Libya
Libya
-
 Lithuania
-
 Luxembourg
-
 Madagascar
-
 Malaysia
-
 Malta
Malta
-
 Mauritius
-
 Mexico
-
 Moldova
-
 Mongolia
-
 Montenegro
-
 Morocco
-
 Mozambique
-
 Myanmar
-
 Namibia
-
 Nepal
Nepal
-
 Netherlands
-
 New Zealand
-
 Nigeria
-
 North Macedonia
-
 Norway
-
 Oman
Oman
-
 Pakistan
-
 Palestine
-
 Panama
-
 Papua New Guinea
-
 Paraguay
-
 Peru
Peru
-
 Philippines
-
 Poland
-
 Portugal
-
 Puerto Rico
-
 Qatar
Qatar
-
 Reunion
-
 Romania
-
 Rwanda
-
 Saudi Arabia
-
 Serbia
-
 Singapore
-
 Slovakia
-
 Slovenia
-
 Somalia
-
 South Africa
-
 Spain
Spain
-
 Sri Lanka
-
 Sweden
-
 Switzerland
-
 Syria
Syria
-
 Taiwan
-
 Tajikistan
-
 Tanzania
-
 Thailand
-
 Trinidad and Tobago
-
 Tunisia
-
 Turkey
-
 UAE
UAE
-
 Uganda
-
 Ukraine
-
 United Kingdom
-
United States
-
 Uruguay
-
 Uzbekistan
-
 Venezuela
-
 Vietnam
-
 Yemen
Yemen
-
 Zambia
-
 Zimbabwe
- Forex
- Crypto
