
Hedera price prediction: Will RBA and ETF news spark recovery? HBAR slips further

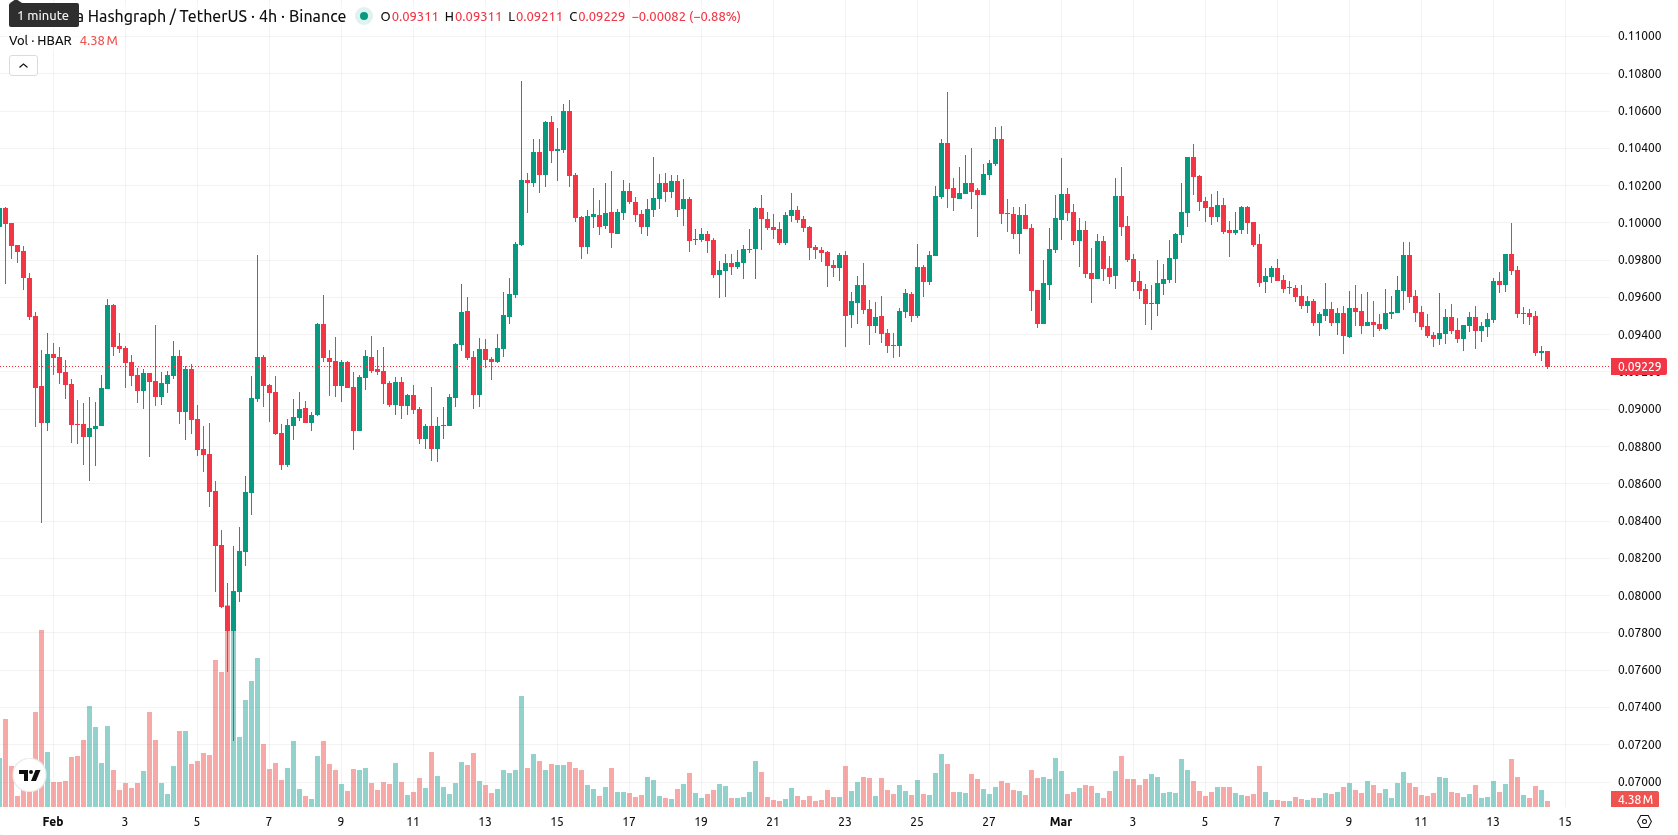
Hedera (HBAR) is trading at $0.0923 after a daily decline of 7.41%. The price remains below the MA-20 ($0.0973), MA-50 ($0.0973), and MA-200 ($0.1506), confirming sustained selling pressure across all timeframes.
Highlights
- The Reserve Bank of Australia leveraged Hedera Hashgraph for wholesale settlement, advancing its CBDC infrastructure project.
- Institutional flows into the Nasdaq-listed Canary Capital ETF provided $93.21 million in Hedera exposure since October 2025, with minimal outflows.
- HBAR remains under strong bearish momentum, likely to consolidate between $0.088 and $0.100, with pronounced downside risk if $0.088 fails.
Institutional inflows and central bank initiatives as price lags adoption
The Reserve Bank of Australia advanced its Central Bank Digital Currency initiative using Hedera’s Hashgraph technology to develop wholesale settlement infrastructure. Institutional investors were reported to have gained exposure to Hedera through a regulated Nasdaq-listed ETF managed by Canary Capital, with $93.21 million in inflows since October 2025 and only one day of outflows. Hedera’s council-based governance model was noted in industry discussions for its alignment with enterprise adoption and regulatory requirements, and appeal to institutions and banks, though price action has remained under broader selling pressure.
Limited bull support as bearish indicators reinforce range-bound trade
Technical indicators reinforce a bearish outlook for HBAR, with the price positioned well below the MA-20, MA-50, and MA-200 moving averages, and immediate resistance at the Ichimoku Kijun level of $0.0998. MACD and ADX on the daily chart both suggest weak bearish momentum, as MACD remains in Sell mode and ADX is low, indicating a lack of trend strength. RSI is neutral at 45.24, Stoch RSI is close to 25, and CCI displays no clear directional bias, while BBP’s flat stance and Buy forecast offer only limited support for buyers. The current price sits at the low end of a tight range ($0.0923 – $0.0953), with volatility moderate and sellers clearly dominating intraday action.
Consolidation risk dominates as technicals signal downside bias
Looking ahead, HBAR’s typical short-term volatility suggests a probable trading band between $0.088 and $0.100 over the next five sessions. The probability of a near-term price increase is estimated at less than 20%, with short-term downside favored as weekly trend indicators (RSI, ADX, MACD, MA-50) indicate ongoing bearishness. The base scenario is for continued consolidation within the $0.088 to $0.100 range. A close above $0.0998 would be required for a bullish shift, while a breakdown below $0.088 could prompt a search for fresh short-term support levels.
Earlier, analysts noted that Hedera was experiencing persistent bearish momentum, with prices remaining subdued under key technical levels and no signs of a bullish reversal. The latest developments—highlighted by institutional adoption and central bank pilot integration—add a new dimension, yet with prevailing market weakness, traders should monitor for a decisive break above $0.0998 or below $0.088 to anticipate the next directional move.


-
 Afghanistan
-
 Albania
-
 Algeria
-
 Angola
-
 Argentina
-
 Armenia
-
 Australia
-
 Austria
-
 Azerbaijan
-
 Bahamas
-
 Bahrain
-
 Bangladesh
-
 Belarus
-
 Belgium
-
 Bolivia
-
 Botswana
-
 Brazil
-
 Brunei
-
 Bulgaria
-
 Cambodia
-
 Cameroon
-
 Canada
-
 Chile
Chile
-
 China
China
-
 Colombia
-
 Congo
Congo
-
 Costa Rica
-
 Cote d'Ivoire
-
 Croatia
-
 Cuba
Cuba
-
 Cyprus
-
 Czechia
-
 DR Congo
-
 Denmark
-
 Dominican Republic
-
 Ecuador
-
 Egypt
Egypt
-
 El Salvador
-
 Estonia
-
 Eswatini
-
 Ethiopia
-
 Finland
-
 France
-
 Georgia
-
 Germany
-
 Ghana
Ghana
-
 Greece
-
 Haiti
Haiti
-
 Hong Kong
-
 Hungary
-
 India
India
-
 Indonesia
-
 Iran, Islamic republic
-
 Iraq
Iraq
-
 Ireland
-
 Israel
-
 Italy
Italy
-
 Jamaica
-
 Japan
Japan
-
 Jordan
-
 Kazakhstan
-
 Kenya
Kenya
-
 Korea
Korea
-
 Kuwait
-
 Kyrgyzstan
-
 Laos
Laos
-
 Latvia
-
 Lebanon
-
 Lesotho
-
 Libya
Libya
-
 Lithuania
-
 Luxembourg
-
 Madagascar
-
 Malaysia
-
 Malta
Malta
-
 Mauritius
-
 Mexico
-
 Moldova
-
 Mongolia
-
 Montenegro
-
 Morocco
-
 Mozambique
-
 Myanmar
-
 Namibia
-
 Nepal
Nepal
-
 Netherlands
-
 New Zealand
-
 Nigeria
-
 North Macedonia
-
 Norway
-
 Oman
Oman
-
 Pakistan
-
 Palestine
-
 Panama
-
 Papua New Guinea
-
 Paraguay
-
 Peru
Peru
-
 Philippines
-
 Poland
-
 Portugal
-
 Puerto Rico
-
 Qatar
Qatar
-
 Reunion
-
 Romania
-
 Rwanda
-
 Saudi Arabia
-
 Serbia
-
 Singapore
-
 Slovakia
-
 Slovenia
-
 Somalia
-
 South Africa
-
 Spain
Spain
-
 Sri Lanka
-
 Sweden
-
 Switzerland
-
 Syria
Syria
-
 Taiwan
-
 Tajikistan
-
 Tanzania
-
 Thailand
-
 Trinidad and Tobago
-
 Tunisia
-
 Turkey
-
 UAE
UAE
-
 Uganda
-
 Ukraine
-
 United Kingdom
-
United States
-
 Uruguay
-
 Uzbekistan
-
 Venezuela
-
 Vietnam
-
 Yemen
Yemen
-
 Zambia
-
 Zimbabwe
- Forex
- Crypto
