
Gala climbs 7.35% as bullish signals emerge despite mixed technicals

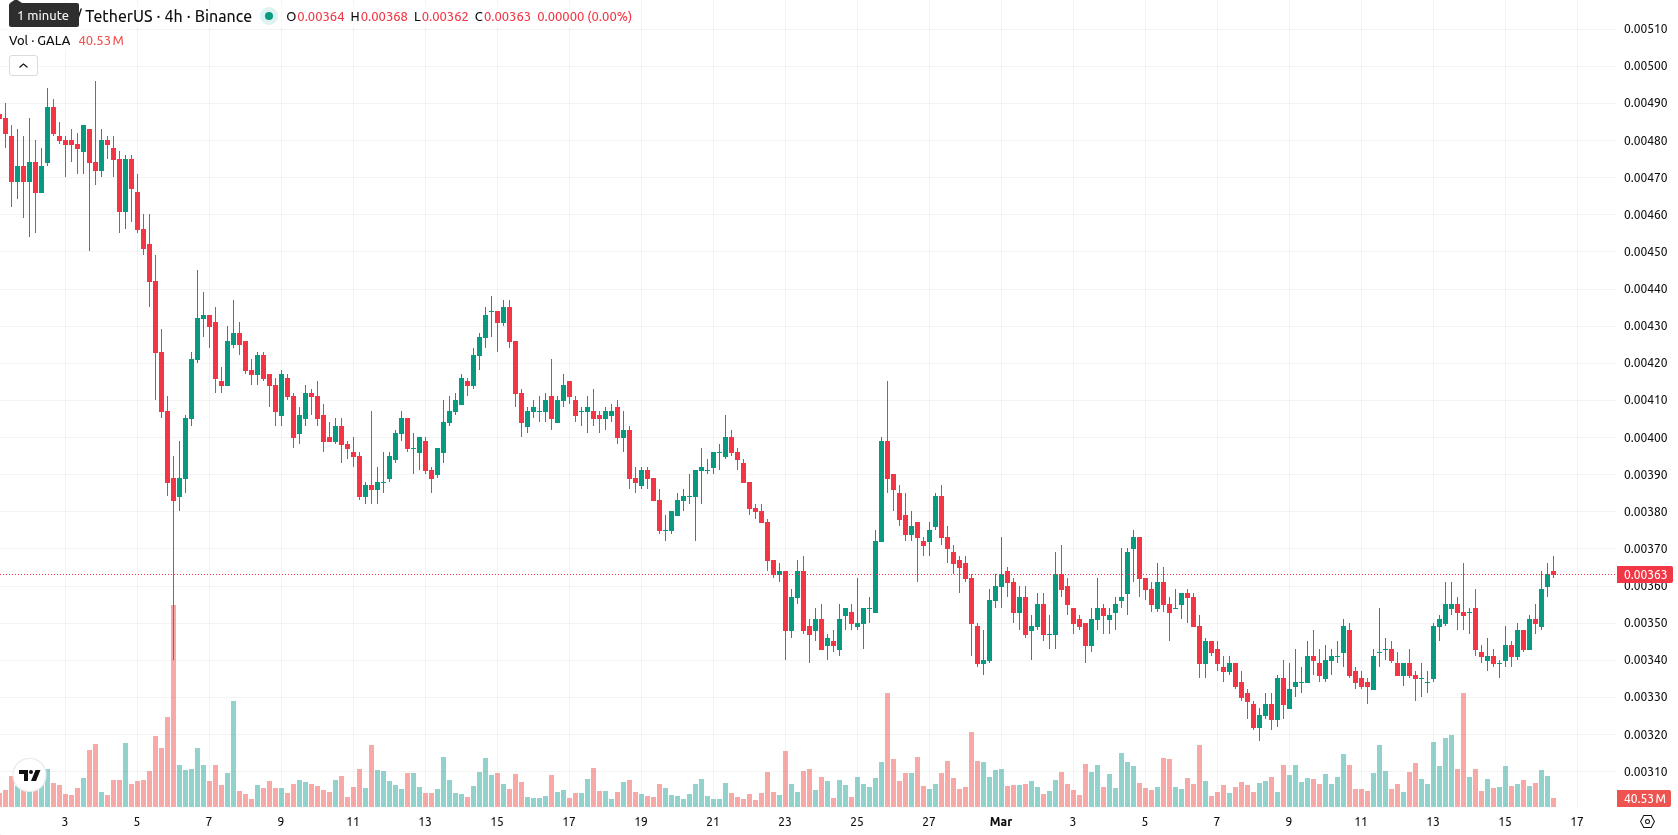
Gala (GALA) is trading at $0.00365, up 7.35% today. The price is above the SMA-20 ($0.00349450), but remains below the SMA-50 ($0.00408600) and SMA-200 ($0.00890960), indicating short-term bullish momentum within an overall bearish medium- to long-term trend.
 0.001865
0.00209700
0.001865
0.00209700
Highlights
- GALA demonstrates short-term bullish momentum, trading above near-term averages but well below medium and long-term trend indicators.
- Momentum and oscillators are mixed—MACD and ADX signals remain bearish, while Stoch RSI is overbought and BBP shows intraday buyer control.
- Price is expected to consolidate between $0.00330 and $0.00380 over five days, with further upside unlikely unless immediate resistance breaks.
Mixed technical signals as momentum and oscillators diverge
Technical indicators show mixed signals: the Ichimoku Kijun is just above price at $0.00366500, marking immediate resistance. MACD remains firmly in 'Strong Sell' territory, the ADX at 32.5 also leans 'Sell', highlighting persistent bearish momentum. RSI stands at 43, suggesting moderately low momentum, while Stoch RSI shows an overbought signal and CCI is neutral — together reflecting a divergence between oscillators and momentum. Bull/Bear Power (BBP) points to buyer dominance intraday, and the Awesome Oscillator is neutral; intraday price action is nearing the session's high in a narrow band ($0.00348– $0.00366) with low volatility.
Low upside probability as consolidation risk dominates near term
Over the next five trading days, GALA is expected to move within a typical volatility band between $0.00330 and $0.00380. The probability of a further price increase is low (less than 20%) according to weekly timeframes, so a pullback or sideways action is more likely. The base scenario is for consolidation within the $0.00330– $0.00380 corridor; a break above $0.00367 would open a short-term bullish scenario, while a drop below $0.00330 could trigger further downside.
Earlier, analysts noted that Gala was entrenched in a bearish trend with limited prospects for a sustained rebound. The latest signals reinforce this outlook, suggesting traders should focus on the $0.00367 resistance for signs of short-term momentum shifts amid ongoing consolidation.


Latest Gala News







-
 Afghanistan
-
 Albania
-
 Algeria
-
 Angola
-
 Argentina
-
 Armenia
-
 Australia
-
 Austria
-
 Azerbaijan
-
 Bahamas
-
 Bahrain
-
 Bangladesh
-
 Belarus
-
 Belgium
-
 Bolivia
-
 Botswana
-
 Brazil
-
 Brunei
-
 Bulgaria
-
 Cambodia
-
 Cameroon
-
 Canada
-
 Chile
Chile
-
 China
China
-
 Colombia
-
 Congo
Congo
-
 Costa Rica
-
 Cote d'Ivoire
-
 Croatia
-
 Cuba
Cuba
-
 Cyprus
-
 Czechia
-
 DR Congo
-
 Denmark
-
 Dominican Republic
-
 Ecuador
-
 Egypt
Egypt
-
 El Salvador
-
 Estonia
-
 Eswatini
-
 Ethiopia
-
 Finland
-
 France
-
 Georgia
-
 Germany
-
 Ghana
Ghana
-
 Greece
-
 Haiti
Haiti
-
 Hong Kong
-
 Hungary
-
 India
India
-
 Indonesia
-
 Iran, Islamic republic
-
 Iraq
Iraq
-
 Ireland
-
 Israel
-
 Italy
Italy
-
 Jamaica
-
 Japan
Japan
-
 Jordan
-
 Kazakhstan
-
 Kenya
Kenya
-
 Korea
Korea
-
 Kuwait
-
 Kyrgyzstan
-
 Laos
Laos
-
 Latvia
-
 Lebanon
-
 Lesotho
-
 Libya
Libya
-
 Lithuania
-
 Luxembourg
-
 Madagascar
-
 Malaysia
-
 Malta
Malta
-
 Mauritius
-
 Mexico
-
 Moldova
-
 Mongolia
-
 Montenegro
-
 Morocco
-
 Mozambique
-
 Myanmar
-
 Namibia
-
 Nepal
Nepal
-
 Netherlands
-
 New Zealand
-
 Nigeria
-
 North Macedonia
-
 Norway
-
 Oman
Oman
-
 Pakistan
-
 Palestine
-
 Panama
-
 Papua New Guinea
-
 Paraguay
-
 Peru
Peru
-
 Philippines
-
 Poland
-
 Portugal
-
 Puerto Rico
-
 Qatar
Qatar
-
 Reunion
-
 Romania
-
 Rwanda
-
 Saudi Arabia
-
 Serbia
-
 Singapore
-
 Slovakia
-
 Slovenia
-
 Somalia
-
 South Africa
-
 Spain
Spain
-
 Sri Lanka
-
 Sweden
-
 Switzerland
-
 Syria
Syria
-
 Taiwan
-
 Tajikistan
-
 Tanzania
-
 Thailand
-
 Trinidad and Tobago
-
 Tunisia
-
 Turkey
-
 UAE
UAE
-
 Uganda
-
 Ukraine
-
 United Kingdom
-
United States
-
 Uruguay
-
 Uzbekistan
-
 Venezuela
-
 Vietnam
-
 Yemen
Yemen
-
 Zambia
-
 Zimbabwe
- Forex
- Crypto












