
Quant: Overbought signals and volatility fuel a 7.74% rally

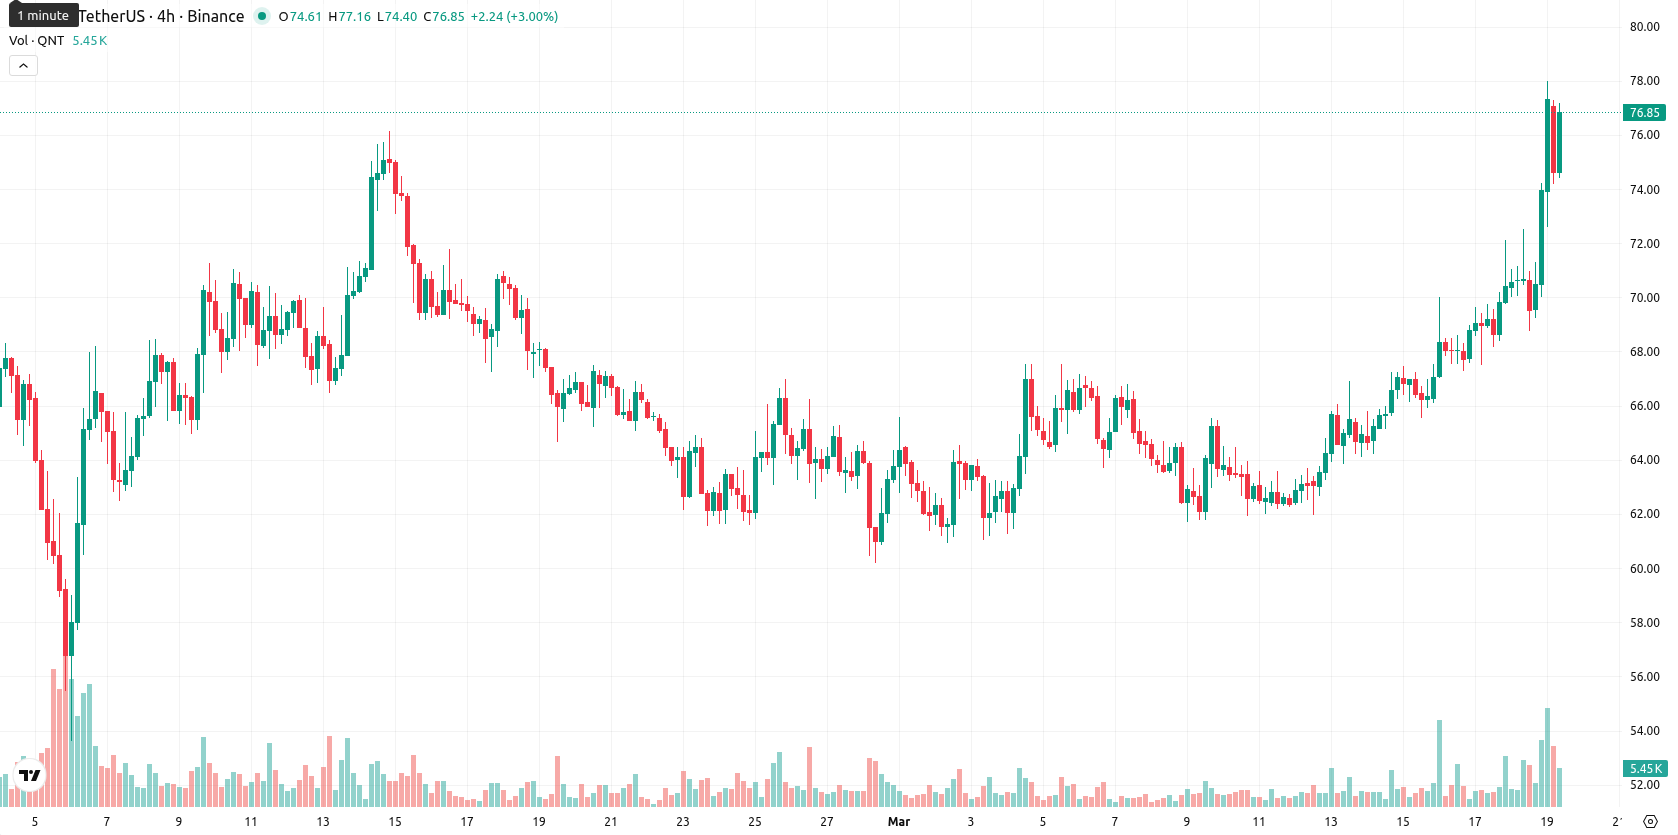
Quant (QNT) is trading at $77.12, which is above the MA-20 ($65.19) and MA-50 ($66.67) but remains below the MA-200 ($81.30). This highlights continued short- and medium-term bullish momentum, while the long-term trend still faces overhead resistance.
 64.48
67.880000
64.48
67.880000
Highlights
- QNT maintains short- and medium-term bullish momentum, trading above key moving averages but still faces long-term resistance below $81.30.
- Momentum signals are mixed, with strong buyer control and several overbought indicators suggesting potential for near-term cooling or consolidation.
- QNT is expected to trade within a $73.00–$82.00 range over the next week, with a sideways or corrective move more likely unless $82.00 is decisively breached.
Mixed momentum signals emerge as buyers sustain session strength
The Ichimoku Kijun level at $66.72 sits below the current price, indicating immediate support. Momentum signals on D1 are mixed: MACD is neutral and the ADX indicates weak trend strength, while the RSI shows a near-overbought read at 66.52. Stoch RSI and CCI are deeply overbought, suggesting the asset could be stretched, but the BBP value confirms firm buyer dominance throughout the session. The AO aligns with the prevailing upward trend, as intraday strength has persisted and volatility has remained high, supporting buyers despite some divergence from neutral signals.
Range-bound outlook expected amid weak probability of breakout
Looking ahead, the expected price corridor for the next week is adjusted to $73.00 – $82.00, reflecting a volatility band relative to current levels and ongoing elevated fluctuations. Based on weekly indicator readings (RSI, ADX, MACD, MA-50), the probability of further significant price increases remains very low at less than 20%, making a corrective or sideways scenario more likely. The baseline scenario anticipates range-bound movement between $73.00 and $82.00. A bullish scenario would require decisively breaking the MA-200 barrier, while a loss of support near $73.00 could invite short-term downside, though current strong buying pressure tempers these risks.
Earlier, analysts noted that Quant was mired in persistent bearish momentum, with sellers dominating and technical indicators highlighting downside risks. The current shift to short- and medium-term bullish momentum signals a reversal in sentiment, but with overbought conditions emerging, traders should closely monitor the $73.00 support as a potential trigger for renewed volatility.








-
 Afghanistan
-
 Albania
-
 Algeria
-
 Angola
-
 Argentina
-
 Armenia
-
 Australia
-
 Austria
-
 Azerbaijan
-
 Bahamas
-
 Bahrain
-
 Bangladesh
-
 Belarus
-
 Belgium
-
 Bolivia
-
 Botswana
-
 Brazil
-
 Brunei
-
 Bulgaria
-
 Cambodia
-
 Cameroon
-
 Canada
-
 Chile
Chile
-
 China
China
-
 Colombia
-
 Congo
Congo
-
 Costa Rica
-
 Cote d'Ivoire
-
 Croatia
-
 Cuba
Cuba
-
 Cyprus
-
 Czechia
-
 DR Congo
-
 Denmark
-
 Dominican Republic
-
 Ecuador
-
 Egypt
Egypt
-
 El Salvador
-
 Estonia
-
 Eswatini
-
 Ethiopia
-
 Finland
-
 France
-
 Georgia
-
 Germany
-
 Ghana
Ghana
-
 Greece
-
 Haiti
Haiti
-
 Hong Kong
-
 Hungary
-
 India
India
-
 Indonesia
-
 Iran, Islamic republic
-
 Iraq
Iraq
-
 Ireland
-
 Israel
-
 Italy
Italy
-
 Jamaica
-
 Japan
Japan
-
 Jordan
-
 Kazakhstan
-
 Kenya
Kenya
-
 Korea
Korea
-
 Kuwait
-
 Kyrgyzstan
-
 Laos
Laos
-
 Latvia
-
 Lebanon
-
 Lesotho
-
 Libya
Libya
-
 Lithuania
-
 Luxembourg
-
 Madagascar
-
 Malaysia
-
 Malta
Malta
-
 Mauritius
-
 Mexico
-
 Moldova
-
 Mongolia
-
 Montenegro
-
 Morocco
-
 Mozambique
-
 Myanmar
-
 Namibia
-
 Nepal
Nepal
-
 Netherlands
-
 New Zealand
-
 Nigeria
-
 North Macedonia
-
 Norway
-
 Oman
Oman
-
 Pakistan
-
 Palestine
-
 Panama
-
 Papua New Guinea
-
 Paraguay
-
 Peru
Peru
-
 Philippines
-
 Poland
-
 Portugal
-
 Puerto Rico
-
 Qatar
Qatar
-
 Reunion
-
 Romania
-
 Rwanda
-
 Saudi Arabia
-
 Serbia
-
 Singapore
-
 Slovakia
-
 Slovenia
-
 Somalia
-
 South Africa
-
 Spain
Spain
-
 Sri Lanka
-
 Sweden
-
 Switzerland
-
 Syria
Syria
-
 Taiwan
-
 Tajikistan
-
 Tanzania
-
 Thailand
-
 Trinidad and Tobago
-
 Tunisia
-
 Turkey
-
 UAE
UAE
-
 Uganda
-
 Ukraine
-
 United Kingdom
-
United States
-
 Uruguay
-
 Uzbekistan
-
 Venezuela
-
 Vietnam
-
 Yemen
Yemen
-
 Zambia
-
 Zimbabwe
- Forex
- Crypto











