
DeXe price prediction: Is a pullback likely as DEXE slips below $7?

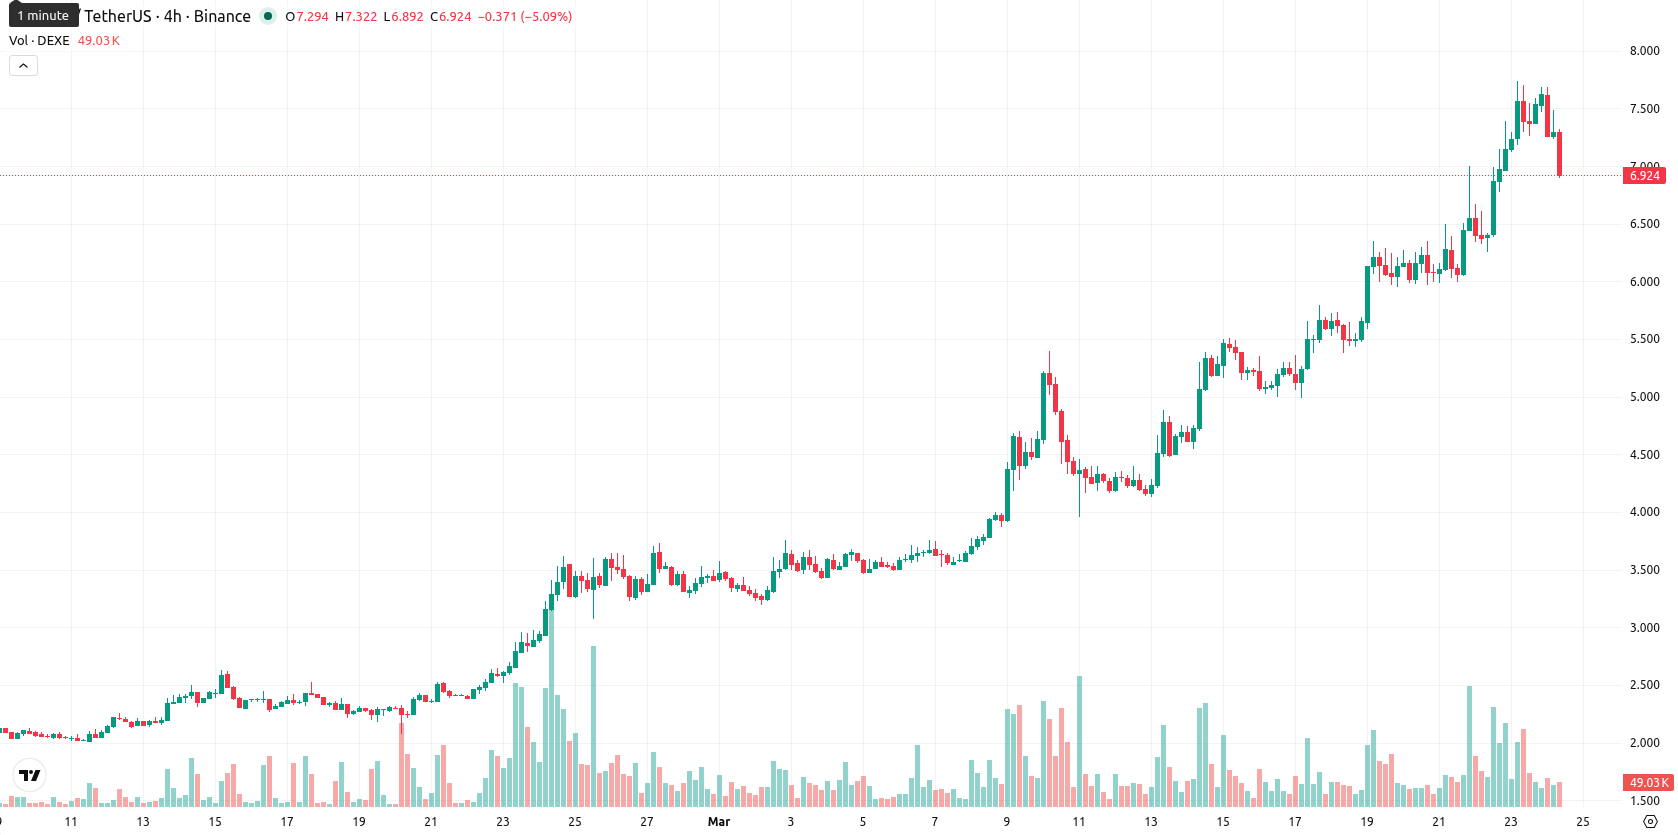
DeXe (DEXE) is trading at $6.92, down 7.46% today and currently sits well above its SMA-20 ($5.04), SMA-50 ($3.57), and SMA-200 ($5.11), indicating a strong bullish structure across all major timeframes.
Highlights
- DEXE maintains a strong overall bullish trend, trading well above short-, medium-, and long-term average prices.
- Momentum remains positive, but technical indicators show an overstretched, overbought market with increased short-term selling pressure.
- DEXE is projected to consolidate in the $6.20–$7.90 range over five days, with a downside bias and elevated volatility.
Overbought momentum diverges from heightened selling pressure
Technically, DEXE maintains its position above all key moving averages, with the D1 Ichimoku Kijun at $5.47 acting as immediate support below the current price. Strong upward momentum is signaled by MACD and ADX, but oscillators indicate overbought conditions, with RSI at 86.96, Stoch RSI at 100.00, and CCI at 170.61. Bull/Bear Power (BBP) confirms ongoing buyer dominance, and the Awesome Oscillator (AO) supports a bullish trend, though the price action has turned negative today with elevated volatility and a close near session lows. This reflects selling pressure after the open, short-term pullback momentum, and divergence between persistent bullish momentum and overbought oscillators.
Low upside probability as price likely consolidates near recent range
Over the next five trading days, DEXE is likely to fluctuate within a typical volatility band between $6.20 and $7.90, reflecting recent price swings and the current market level. Probability of a price increase is low (under 20%), so a decline or sideways action is more probable. The base scenario foresees consolidation within the $6.20–$7.90 corridor. A decisive move above $7.90 could open the way for further gains, while a break below $6.20 would signal an increased risk of a deeper short-term correction.
Earlier, analysts noted that DeXe was exhibiting strong upward momentum with ongoing bullish signals despite emerging overbought risks. The current pullback, while the asset remains above all major moving averages, underscores heightened volatility and suggests traders should watch for potential consolidation to persist, with particular attention to any challenge of the $6.20 support level in the near term.


-
 Afghanistan
-
 Albania
-
 Algeria
-
 Angola
-
 Argentina
-
 Armenia
-
 Australia
-
 Austria
-
 Azerbaijan
-
 Bahamas
-
 Bahrain
-
 Bangladesh
-
 Belarus
-
 Belgium
-
 Bolivia
-
 Botswana
-
 Brazil
-
 Brunei
-
 Bulgaria
-
 Cambodia
-
 Cameroon
-
 Canada
-
 Chile
Chile
-
 China
China
-
 Colombia
-
 Congo
Congo
-
 Costa Rica
-
 Cote d'Ivoire
-
 Croatia
-
 Cuba
Cuba
-
 Cyprus
-
 Czechia
-
 DR Congo
-
 Denmark
-
 Dominican Republic
-
 Ecuador
-
 Egypt
Egypt
-
 El Salvador
-
 Estonia
-
 Eswatini
-
 Ethiopia
-
 Finland
-
 France
-
 Georgia
-
 Germany
-
 Ghana
Ghana
-
 Greece
-
 Haiti
Haiti
-
 Hong Kong
-
 Hungary
-
 India
India
-
 Indonesia
-
 Iran, Islamic republic
-
 Iraq
Iraq
-
 Ireland
-
 Israel
-
 Italy
Italy
-
 Jamaica
-
 Japan
Japan
-
 Jordan
-
 Kazakhstan
-
 Kenya
Kenya
-
 Korea
Korea
-
 Kuwait
-
 Kyrgyzstan
-
 Laos
Laos
-
 Latvia
-
 Lebanon
-
 Lesotho
-
 Libya
Libya
-
 Lithuania
-
 Luxembourg
-
 Madagascar
-
 Malaysia
-
 Malta
Malta
-
 Mauritius
-
 Mexico
-
 Moldova
-
 Mongolia
-
 Montenegro
-
 Morocco
-
 Mozambique
-
 Myanmar
-
 Namibia
-
 Nepal
Nepal
-
 Netherlands
-
 New Zealand
-
 Nigeria
-
 North Macedonia
-
 Norway
-
 Oman
Oman
-
 Pakistan
-
 Palestine
-
 Panama
-
 Papua New Guinea
-
 Paraguay
-
 Peru
Peru
-
 Philippines
-
 Poland
-
 Portugal
-
 Puerto Rico
-
 Qatar
Qatar
-
 Reunion
-
 Romania
-
 Rwanda
-
 Saudi Arabia
-
 Serbia
-
 Singapore
-
 Slovakia
-
 Slovenia
-
 Somalia
-
 South Africa
-
 Spain
Spain
-
 Sri Lanka
-
 Sweden
-
 Switzerland
-
 Syria
Syria
-
 Taiwan
-
 Tajikistan
-
 Tanzania
-
 Thailand
-
 Trinidad and Tobago
-
 Tunisia
-
 Turkey
-
 UAE
UAE
-
 Uganda
-
 Ukraine
-
 United Kingdom
-
United States
-
 Uruguay
-
 Uzbekistan
-
 Venezuela
-
 Vietnam
-
 Yemen
Yemen
-
 Zambia
-
 Zimbabwe
- Forex
- Crypto
