
NEAR price prediction: Can $1.2780–$1.3720 hold as NEAR posts a breakout move?

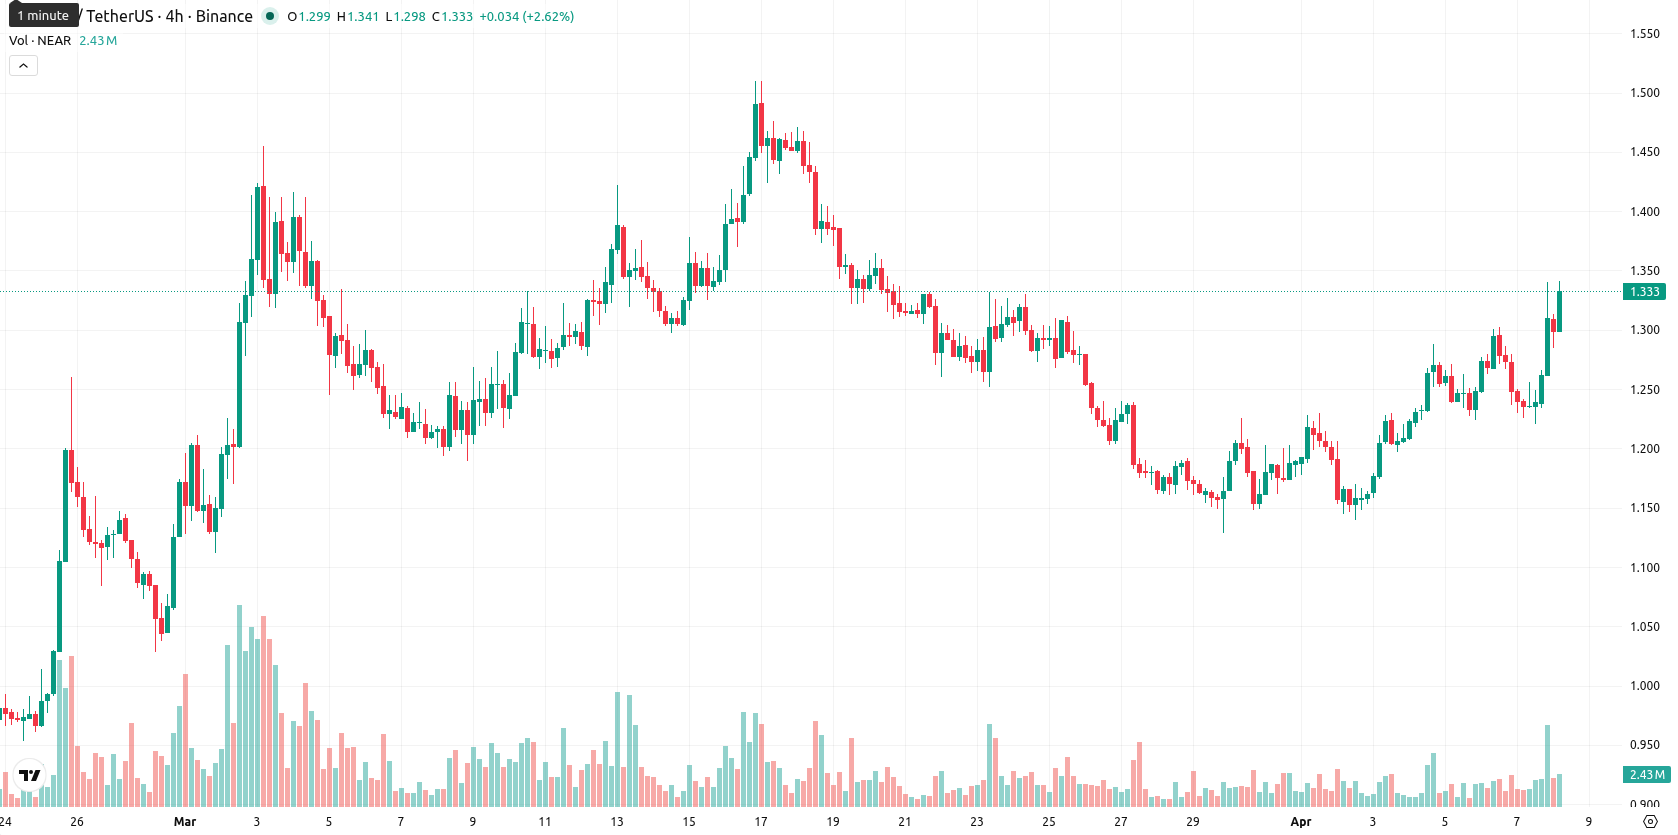
NEAR (NEAR) is trading at $1.336 after gaining 8.44% today, with momentum holding above both the SMA-20 ($1.2410) and SMA-50 ($1.2233). It remains below the long-term SMA-200 ($1.7616), highlighting continued downward pressure from higher timeframes.
Highlights
- NEAR exhibits short-term bullish momentum, trading above key short-term averages despite remaining under long-term resistance.
- Momentum indicators are mixed, with some overbought signals suggesting elevated risk of a near-term pullback or pause.
- NEAR is expected to range between $1.2780 and $1.3720 over the next five days, with a higher probability of downward movement than sustained upside.
Mixed oscillator signals as buyer strength meets overbought risk
Technically, NEAR’s price is supported near the Ichimoku Kijun level at $1.3195. Key oscillators on the daily chart are mixed: the MACD and ADX are neutral, the RSI indicates building upward momentum but is not overbought, while Stoch RSI and CCI both show overbought conditions, indicating a risk of near-term pullback. The BBP highlights strong buyer dominance intraday, with the price sitting close to the session’s high in a moderately volatile environment. Despite persistent short-term buying, several oscillators caution that a pause or correction is likely due to overextended readings.
Downside risk dominates as resistance caps near-term upside
Over the next five trading days, NEAR is expected to trade between $1.2780 and $1.3720, a volatility band relative to current levels. The probability of a sustained price advance remains very low (less than 20%), while downside risk is more notable, as reflected by Sell signals from the weekly MAs, RSI (W1), and MACD (W1). Baseline expectations point to continued sideways movement bounded by support and resistance. A clear break above $1.3720 would point to a bullish reversal, whereas a fall below $1.2780 could trigger further declines in line with longer-term technical weakness.
Previously it was reported that NEAR was exhibiting persistent short- and medium-term bullish momentum, though it remained constrained by longer-term resistance. Currently, a shift in technical outlook underscores rising downside risk and increases the importance of monitoring any breakdown below $1.2780, which could accelerate declines amid fading bullish conviction.


Latest NEAR News


-
 Afghanistan
-
 Albania
-
 Algeria
-
 Angola
-
 Argentina
-
 Armenia
-
 Australia
-
 Austria
-
 Azerbaijan
-
 Bahamas
-
 Bahrain
-
 Bangladesh
-
 Belarus
-
 Belgium
-
 Bolivia
-
 Botswana
-
 Brazil
-
 Brunei
-
 Bulgaria
-
 Cambodia
-
 Cameroon
-
 Canada
-
 Chile
Chile
-
 China
China
-
 Colombia
-
 Congo
Congo
-
 Costa Rica
-
 Cote d'Ivoire
-
 Croatia
-
 Cuba
Cuba
-
 Cyprus
-
 Czechia
-
 DR Congo
-
 Denmark
-
 Dominican Republic
-
 Ecuador
-
 Egypt
Egypt
-
 El Salvador
-
 Estonia
-
 Eswatini
-
 Ethiopia
-
 Finland
-
 France
-
 Georgia
-
 Germany
-
 Ghana
Ghana
-
 Greece
-
 Haiti
Haiti
-
 Hong Kong
-
 Hungary
-
 India
India
-
 Indonesia
-
 Iran, Islamic republic
-
 Iraq
Iraq
-
 Ireland
-
 Israel
-
 Italy
Italy
-
 Jamaica
-
 Japan
Japan
-
 Jordan
-
 Kazakhstan
-
 Kenya
Kenya
-
 Korea
Korea
-
 Kuwait
-
 Kyrgyzstan
-
 Laos
Laos
-
 Latvia
-
 Lebanon
-
 Lesotho
-
 Libya
Libya
-
 Lithuania
-
 Luxembourg
-
 Madagascar
-
 Malaysia
-
 Malta
Malta
-
 Mauritius
-
 Mexico
-
 Moldova
-
 Mongolia
-
 Montenegro
-
 Morocco
-
 Mozambique
-
 Myanmar
-
 Namibia
-
 Nepal
Nepal
-
 Netherlands
-
 New Zealand
-
 Nigeria
-
 North Macedonia
-
 Norway
-
 Oman
Oman
-
 Pakistan
-
 Palestine
-
 Panama
-
 Papua New Guinea
-
 Paraguay
-
 Peru
Peru
-
 Philippines
-
 Poland
-
 Portugal
-
 Puerto Rico
-
 Qatar
Qatar
-
 Reunion
-
 Romania
-
 Rwanda
-
 Saudi Arabia
-
 Serbia
-
 Singapore
-
 Slovakia
-
 Slovenia
-
 Somalia
-
 South Africa
-
 Spain
Spain
-
 Sri Lanka
-
 Sweden
-
 Switzerland
-
 Syria
Syria
-
 Taiwan
-
 Tajikistan
-
 Tanzania
-
 Thailand
-
 Trinidad and Tobago
-
 Tunisia
-
 Turkey
-
 UAE
UAE
-
 Uganda
-
 Ukraine
-
 United Kingdom
-
United States
-
 Uruguay
-
 Uzbekistan
-
 Venezuela
-
 Vietnam
-
 Yemen
Yemen
-
 Zambia
-
 Zimbabwe
- Forex
- Crypto
