
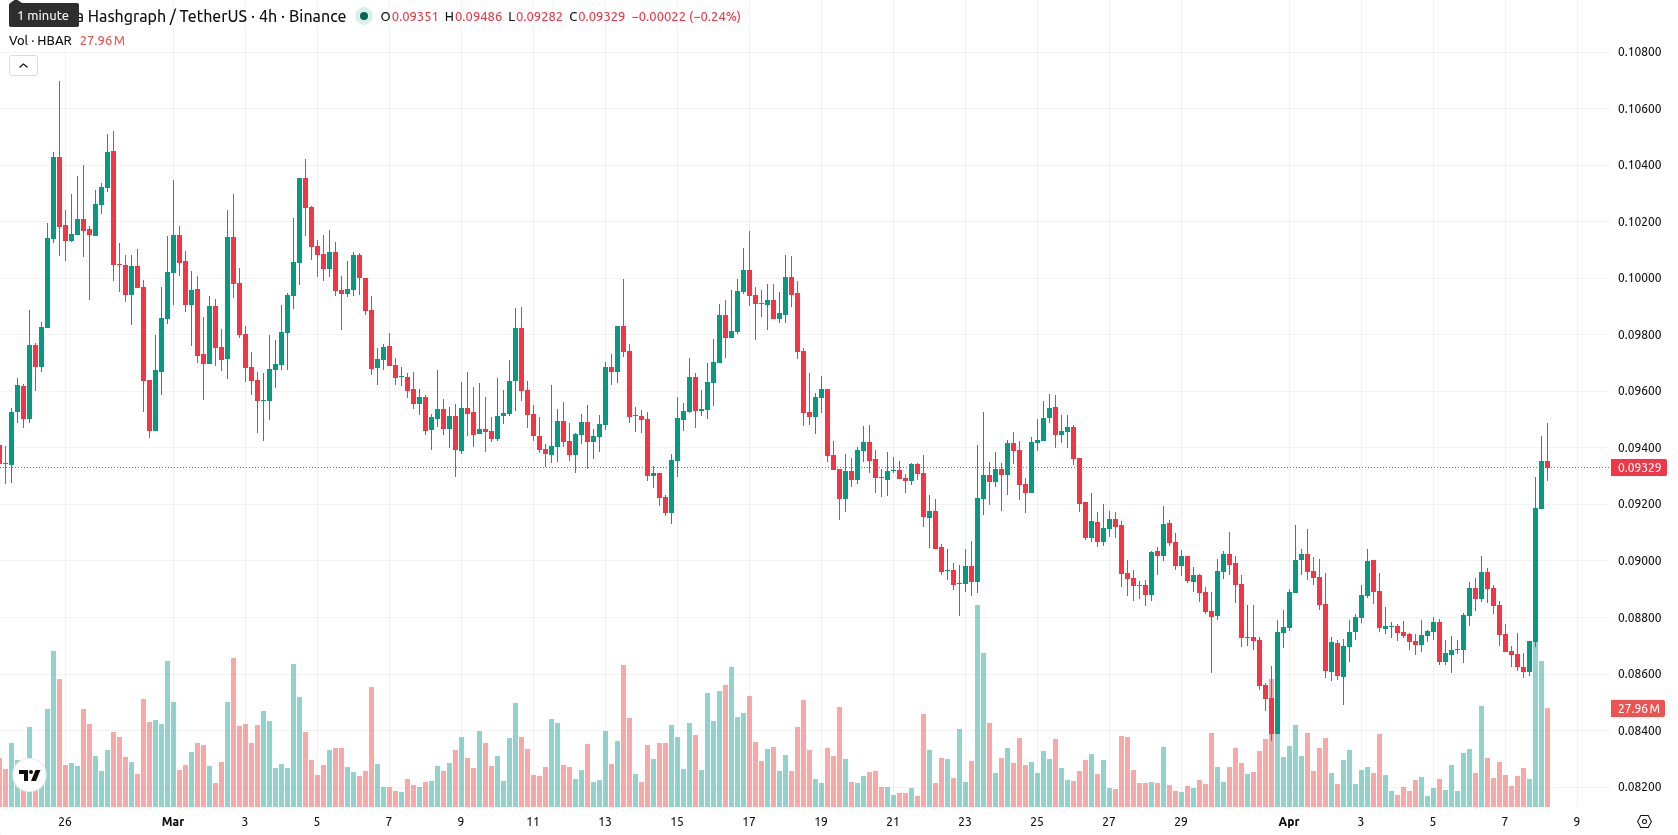
Hedera price prediction: $0.0926 support in focus as HBAR climbs 7.99%

Hedera (HBAR) is trading at $0.0933, just above both the SMA-20 ($0.0901) and the Ichimoku Kijun ($0.0926), but slightly below the SMA-50 ($0.0946). This setup signals short-term bullish momentum, while medium- and long-term trends remain under pressure as the price is still well beneath the SMA-200 ($0.1332); the Ichimoku Kijun at $0.0926 now acts as immediate support.
Highlights
- McLaren's entry into the Hedera Council has intensified institutional focus on Hedera’s enterprise Web3 and digital asset capabilities.
- Hedera’s market position is strengthening due to heightened enterprise interest in its governance model, speed, and security, amid evolving regulatory dynamics.
- HBAR trades with short-term bullish momentum and high volatility, but persistent bearish signals suggest a likely sideways or downward move between $0.0900 and $0.0975 this week.
Enterprise engagement rises as McLaren joins Hedera Council
Hedera has drawn increased attention after McLaren joined the Hedera Council, boosting enterprise engagement in Web3 experiences and digital assets. This move reflects greater institutional interest as companies explore Hedera's governance model, speed, and security. Regulatory developments are also contributing to stronger positioning among market participants.
Oscillator divergence increases as intraday upside momentum accelerates
Momentum indicators on the daily chart present a mixed picture. MACD remains on a strong sell while ADX indicates weak trend strength, but BBP points to clear buyer dominance, and RSI is modestly bullish at 53. The Stoch RSI reads as extremely overbought and CCI is neutral, creating divergence among oscillators. There was a gap up at the open, with the current price sitting near today’s high after posting a 7.99% daily gain. Intraday volatility has been high, and the tone is marked by strong upside momentum toward session highs, which aligns with the bullish BBP but contradicts persistent negative signals from MACD.
Sideways bias prevails as weekly indicators reinforce downside risk
For the next five trading days, a typical volatility band relative to current levels is expected between $0.0900 and $0.0975. As all weekly indicators — RSI, ADX, MACD, and SMA-50 — remain bearish, the likelihood of further price increases is low (below 20%), while a decline is more probable. The baseline scenario points to sideways movement near current levels. A bullish setup would require a breakout above $0.0946, with the bearish case seeing a drop below immediate support at $0.0926.
Earlier, analysts noted that Hedera was experiencing persistent bearish momentum despite institutional adoption and integration with central bank initiatives. The current setup introduces signs of emerging short-term strength, yet with long-term trends still under pressure, traders should closely watch for a decisive breakout above $0.0946 to signal a potential shift in direction.


-
 Afghanistan
-
 Albania
-
 Algeria
-
 Angola
-
 Argentina
-
 Armenia
-
 Australia
-
 Austria
-
 Azerbaijan
-
 Bahamas
-
 Bahrain
-
 Bangladesh
-
 Belarus
-
 Belgium
-
 Bolivia
-
 Botswana
-
 Brazil
-
 Brunei
-
 Bulgaria
-
 Cambodia
-
 Cameroon
-
 Canada
-
 Chile
Chile
-
 China
China
-
 Colombia
-
 Congo
Congo
-
 Costa Rica
-
 Cote d'Ivoire
-
 Croatia
-
 Cuba
Cuba
-
 Cyprus
-
 Czechia
-
 DR Congo
-
 Denmark
-
 Dominican Republic
-
 Ecuador
-
 Egypt
Egypt
-
 El Salvador
-
 Estonia
-
 Eswatini
-
 Ethiopia
-
 Finland
-
 France
-
 Georgia
-
 Germany
-
 Ghana
Ghana
-
 Greece
-
 Haiti
Haiti
-
 Hong Kong
-
 Hungary
-
 India
India
-
 Indonesia
-
 Iran, Islamic republic
-
 Iraq
Iraq
-
 Ireland
-
 Israel
-
 Italy
Italy
-
 Jamaica
-
 Japan
Japan
-
 Jordan
-
 Kazakhstan
-
 Kenya
Kenya
-
 Korea
Korea
-
 Kuwait
-
 Kyrgyzstan
-
 Laos
Laos
-
 Latvia
-
 Lebanon
-
 Lesotho
-
 Libya
Libya
-
 Lithuania
-
 Luxembourg
-
 Madagascar
-
 Malaysia
-
 Malta
Malta
-
 Mauritius
-
 Mexico
-
 Moldova
-
 Mongolia
-
 Montenegro
-
 Morocco
-
 Mozambique
-
 Myanmar
-
 Namibia
-
 Nepal
Nepal
-
 Netherlands
-
 New Zealand
-
 Nigeria
-
 North Macedonia
-
 Norway
-
 Oman
Oman
-
 Pakistan
-
 Palestine
-
 Panama
-
 Papua New Guinea
-
 Paraguay
-
 Peru
Peru
-
 Philippines
-
 Poland
-
 Portugal
-
 Puerto Rico
-
 Qatar
Qatar
-
 Reunion
-
 Romania
-
 Rwanda
-
 Saudi Arabia
-
 Serbia
-
 Singapore
-
 Slovakia
-
 Slovenia
-
 Somalia
-
 South Africa
-
 Spain
Spain
-
 Sri Lanka
-
 Sweden
-
 Switzerland
-
 Syria
Syria
-
 Taiwan
-
 Tajikistan
-
 Tanzania
-
 Thailand
-
 Trinidad and Tobago
-
 Tunisia
-
 Turkey
-
 UAE
UAE
-
 Uganda
-
 Ukraine
-
 United Kingdom
-
United States
-
 Uruguay
-
 Uzbekistan
-
 Venezuela
-
 Vietnam
-
 Yemen
Yemen
-
 Zambia
-
 Zimbabwe
- Forex
- Crypto
