
Hedera advances 3.28 percent as RSI approaches oversold territory: weekly report

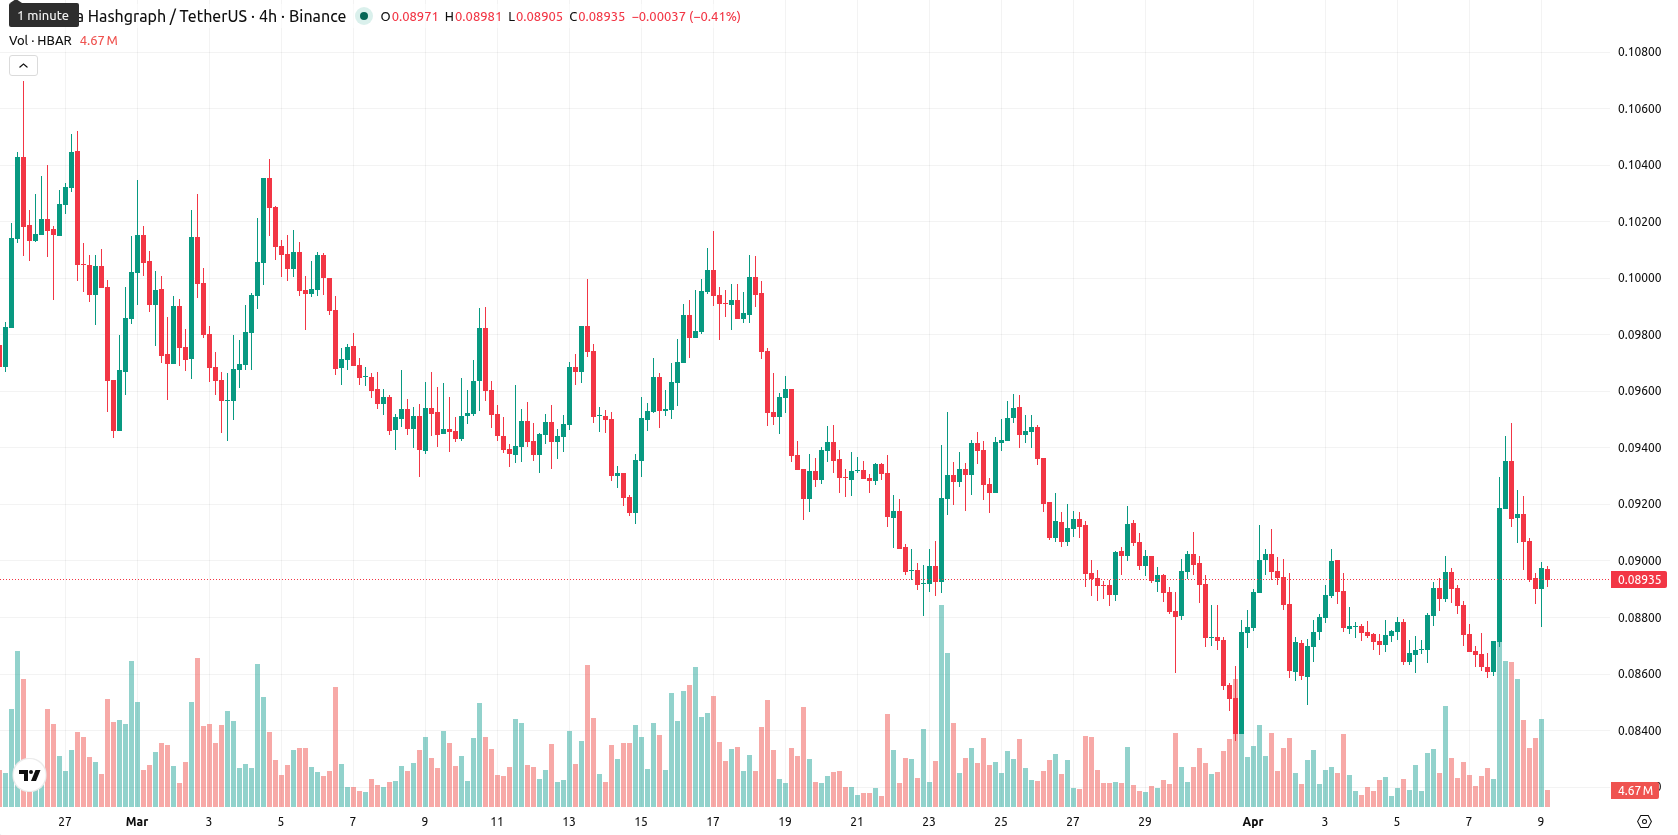
Hedera (HBAR) is currently trading at $0.0893, having gained $0.0029 (3.28%) over the past week. The asset remains below its weekly MA-20 ($0.1048), MA-50 ($0.1632), and MA-200 ($0.1098), highlighting sustained bearish momentum and indicating pressure from sellers as HBAR stays in the lower part of its weekly range.
Highlights
- HBAR remains under bearish momentum, trading below key moving averages with persistent selling pressure and weak trend strength.
- Weekly technical indicators point to a market approaching oversold territory, but upside potential is limited by dominant sellers.
- For the next week, HBAR is expected to trade sideways in the $0.0800–$0.0990 range, with a higher likelihood of a downside break.
Institutional interest rises as council expansion and regulatory clarity lift sentiment
Hedera's Governing Council expanded to include McLaren Racing, connecting the network with over 600 million Formula 1 viewers. The network processed over $10 billion in real-world asset settlements and topped all public blockchains for real-world asset development activity. Regulatory clarity was achieved when both the SEC and CFTC classified HBAR as a digital commodity, enabling institutional investment products like the Canary Capital HBAR ETF and Hashdex crypto fund. Secondary developments include the launch of Agent Lab and new cross-chain interoperability features.
Downside pressure persists as technicals signal bearish continuation this week
On the weekly chart, HBAR trades well below the MA-20, MA-50, and MA-200, which reinforces a bearish trend with dynamic resistance overhead. Weekly indicators show negative momentum: the MACD and ADX hint at further downside while RSI (33) and CCI (-79) edge toward oversold territory. The Stochastic RSI remains mixed, and Bull/Bear Power confirms sellers remain dominant. Support for the week is near $0.0800, with resistance at $0.0990.
Range-bound outlook holds as volatility and bearish bias drive next week’s risk
For the next 7 days, HBAR is expected to trade mostly sideways between $0.0800 and $0.0990, consistent with the prevailing weekly volatility of 10.61%. Technical signals continue to indicate a higher risk of further downside, with less than a 20% probability of a decisive upward move. The base scenario favors range-bound action, while a push above $0.0990 appears unlikely unless buyers return. A breakdown below $0.0800 would reinforce the current downtrend if selling pressure intensifies.
Earlier, analysts noted that despite some signs of short-term strength, Hedera continued to face largely bearish momentum amid persistent selling pressure. The current analysis not only reaffirms this negative outlook with new evidence of sustained weakness on higher timeframes, but also highlights that any shift in trend will likely depend on whether buyers can reclaim resistance near $0.0990 in the coming week.


-
 Afghanistan
-
 Albania
-
 Algeria
-
 Angola
-
 Argentina
-
 Armenia
-
 Australia
-
 Austria
-
 Azerbaijan
-
 Bahamas
-
 Bahrain
-
 Bangladesh
-
 Belarus
-
 Belgium
-
 Bolivia
-
 Botswana
-
 Brazil
-
 Brunei
-
 Bulgaria
-
 Cambodia
-
 Cameroon
-
 Canada
-
 Chile
Chile
-
 China
China
-
 Colombia
-
 Congo
Congo
-
 Costa Rica
-
 Cote d'Ivoire
-
 Croatia
-
 Cuba
Cuba
-
 Cyprus
-
 Czechia
-
 DR Congo
-
 Denmark
-
 Dominican Republic
-
 Ecuador
-
 Egypt
Egypt
-
 El Salvador
-
 Estonia
-
 Eswatini
-
 Ethiopia
-
 Finland
-
 France
-
 Georgia
-
 Germany
-
 Ghana
Ghana
-
 Greece
-
 Haiti
Haiti
-
 Hong Kong
-
 Hungary
-
 India
India
-
 Indonesia
-
 Iran, Islamic republic
-
 Iraq
Iraq
-
 Ireland
-
 Israel
-
 Italy
Italy
-
 Jamaica
-
 Japan
Japan
-
 Jordan
-
 Kazakhstan
-
 Kenya
Kenya
-
 Korea
Korea
-
 Kuwait
-
 Kyrgyzstan
-
 Laos
Laos
-
 Latvia
-
 Lebanon
-
 Lesotho
-
 Libya
Libya
-
 Lithuania
-
 Luxembourg
-
 Madagascar
-
 Malaysia
-
 Malta
Malta
-
 Mauritius
-
 Mexico
-
 Moldova
-
 Mongolia
-
 Montenegro
-
 Morocco
-
 Mozambique
-
 Myanmar
-
 Namibia
-
 Nepal
Nepal
-
 Netherlands
-
 New Zealand
-
 Nigeria
-
 North Macedonia
-
 Norway
-
 Oman
Oman
-
 Pakistan
-
 Palestine
-
 Panama
-
 Papua New Guinea
-
 Paraguay
-
 Peru
Peru
-
 Philippines
-
 Poland
-
 Portugal
-
 Puerto Rico
-
 Qatar
Qatar
-
 Reunion
-
 Romania
-
 Rwanda
-
 Saudi Arabia
-
 Serbia
-
 Singapore
-
 Slovakia
-
 Slovenia
-
 Somalia
-
 South Africa
-
 Spain
Spain
-
 Sri Lanka
-
 Sweden
-
 Switzerland
-
 Syria
Syria
-
 Taiwan
-
 Tajikistan
-
 Tanzania
-
 Thailand
-
 Trinidad and Tobago
-
 Tunisia
-
 Turkey
-
 UAE
UAE
-
 Uganda
-
 Ukraine
-
 United Kingdom
-
United States
-
 Uruguay
-
 Uzbekistan
-
 Venezuela
-
 Vietnam
-
 Yemen
Yemen
-
 Zambia
-
 Zimbabwe
- Forex
- Crypto
