
Solana price prediction: $87.19 resistance in focus as SOL advances

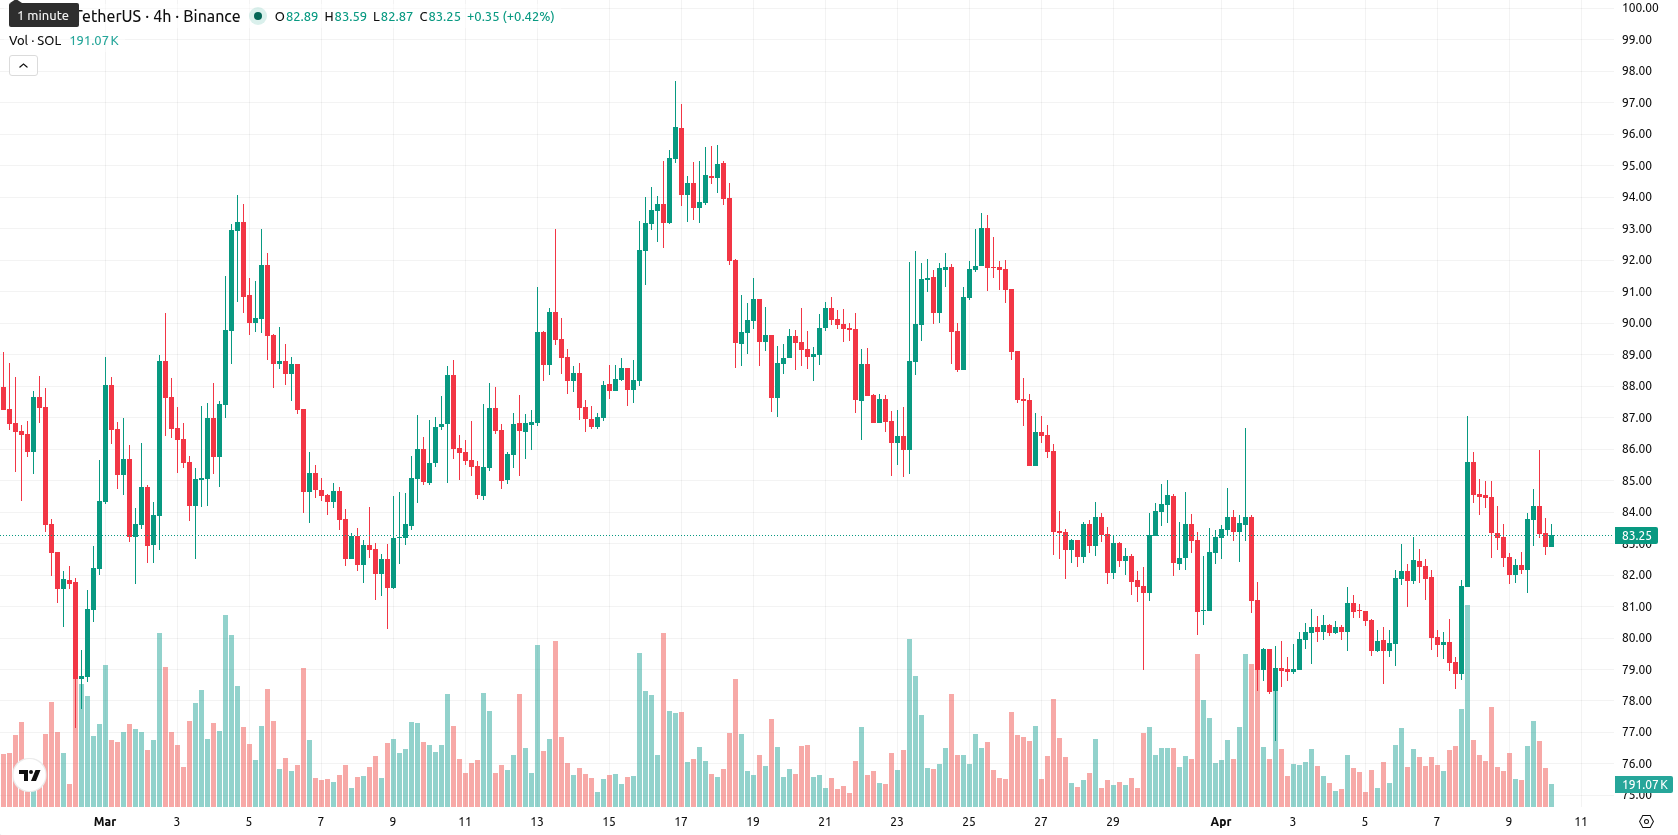
Solana (SOL) is trading at $83.25, rising 1.44% today and currently positioned below the SMA-20 ($84.08), SMA-50 ($85.45), and SMA-200 ($132.55), indicating persistent downside pressure. The current price is also below the Ichimoku Kijun level ($87.19), which acts as immediate resistance.
Highlights
- Solana introduced the CONTRA private-layer solution in Korea to address regulatory and privacy demands, with further stablecoin initiatives forthcoming.
- Despite a decrease in monthly active addresses to 34 million, total Solana holders reached 167 million, signaling robust long-term participation.
- SOL faces ongoing downside pressure, trading below key averages, with sideways movement likely within an $81.50–$85.50 range barring a break of immediate support or resistance.
Network growth diverges from activity as Korea news shapes sentiment
Solana’s Korea head has confirmed the launch of the CONTRA private-layer solution to address regulatory and privacy needs, with plans to present further stablecoin and CONTRA strategies at an upcoming investment show. The number of Solana holders reached a reported 167 million, reflecting strong network participation, while monthly active addresses decreased to 34 million from 40 million in March. DeFi Development Corp disclosed holding approximately 2.22 million SOL tokens in its treasury at the end of March.
Bearish momentum persists as overbought signals clash with weak trend
Technical review shows SOL remaining below all key moving averages, with immediate resistance at the Ichimoku Kijun level of $87.19. MACD provides a strong sell signal, ADX indicates weak trend strength, and the daily RSI sits just under 50, leaning bearish. Stoch RSI and CCI are neutral, but BBP is still firmly in overbought territory, highlighting a divergence between persistent short-term buying and lacking sustained momentum. Trading volume remains subdued, price is near the midpoint of the day’s range ($82.76–$83.66), and volatility is low.
Further downside likely as narrow range and weak signals persist
Over the next five trading days, the typical volatility range is projected between $81.50 and $85.50 based on recent weekly patterns and current levels. None of the weekly signals (RSI, ADX, MACD, or MA-50 on weekly chart) currently support a bullish move, making further downside more likely and the probability of a sustained rise less than 20%. Baseline scenario: SOL trades sideways within this narrow corridor. Scenario shifts occur if the price closes above immediate resistance at $87.19 or falls below support near $81.50.
Previously it was reported that Solana’s price remained under pressure amid subdued technical indicators and uncertainty despite rising institutional and network activity. With the introduction of privacy-focused solutions and evolving user demographics, traders should watch for any decisive move above the $87.19 resistance, which could challenge the prevailing sideways scenario.


Latest Solana News


-
 Afghanistan
-
 Albania
-
 Algeria
-
 Angola
-
 Argentina
-
 Armenia
-
 Australia
-
 Austria
-
 Azerbaijan
-
 Bahamas
-
 Bahrain
-
 Bangladesh
-
 Belarus
-
 Belgium
-
 Bolivia
-
 Botswana
-
 Brazil
-
 Brunei
-
 Bulgaria
-
 Cambodia
-
 Cameroon
-
 Canada
-
 Chile
Chile
-
 China
China
-
 Colombia
-
 Congo
Congo
-
 Costa Rica
-
 Cote d'Ivoire
-
 Croatia
-
 Cuba
Cuba
-
 Cyprus
-
 Czechia
-
 DR Congo
-
 Denmark
-
 Dominican Republic
-
 Ecuador
-
 Egypt
Egypt
-
 El Salvador
-
 Estonia
-
 Eswatini
-
 Ethiopia
-
 Finland
-
 France
-
 Georgia
-
 Germany
-
 Ghana
Ghana
-
 Greece
-
 Haiti
Haiti
-
 Hong Kong
-
 Hungary
-
 India
India
-
 Indonesia
-
 Iran, Islamic republic
-
 Iraq
Iraq
-
 Ireland
-
 Israel
-
 Italy
Italy
-
 Jamaica
-
 Japan
Japan
-
 Jordan
-
 Kazakhstan
-
 Kenya
Kenya
-
 Korea
Korea
-
 Kuwait
-
 Kyrgyzstan
-
 Laos
Laos
-
 Latvia
-
 Lebanon
-
 Lesotho
-
 Libya
Libya
-
 Lithuania
-
 Luxembourg
-
 Madagascar
-
 Malaysia
-
 Malta
Malta
-
 Mauritius
-
 Mexico
-
 Moldova
-
 Mongolia
-
 Montenegro
-
 Morocco
-
 Mozambique
-
 Myanmar
-
 Namibia
-
 Nepal
Nepal
-
 Netherlands
-
 New Zealand
-
 Nigeria
-
 North Macedonia
-
 Norway
-
 Oman
Oman
-
 Pakistan
-
 Palestine
-
 Panama
-
 Papua New Guinea
-
 Paraguay
-
 Peru
Peru
-
 Philippines
-
 Poland
-
 Portugal
-
 Puerto Rico
-
 Qatar
Qatar
-
 Reunion
-
 Romania
-
 Rwanda
-
 Saudi Arabia
-
 Serbia
-
 Singapore
-
 Slovakia
-
 Slovenia
-
 Somalia
-
 South Africa
-
 Spain
Spain
-
 Sri Lanka
-
 Sweden
-
 Switzerland
-
 Syria
Syria
-
 Taiwan
-
 Tajikistan
-
 Tanzania
-
 Thailand
-
 Trinidad and Tobago
-
 Tunisia
-
 Turkey
-
 UAE
UAE
-
 Uganda
-
 Ukraine
-
 United Kingdom
-
United States
-
 Uruguay
-
 Uzbekistan
-
 Venezuela
-
 Vietnam
-
 Yemen
Yemen
-
 Zambia
-
 Zimbabwe
- Forex
- Crypto
