
NEAR edges higher as price holds above MA-20 support: weekly outlook

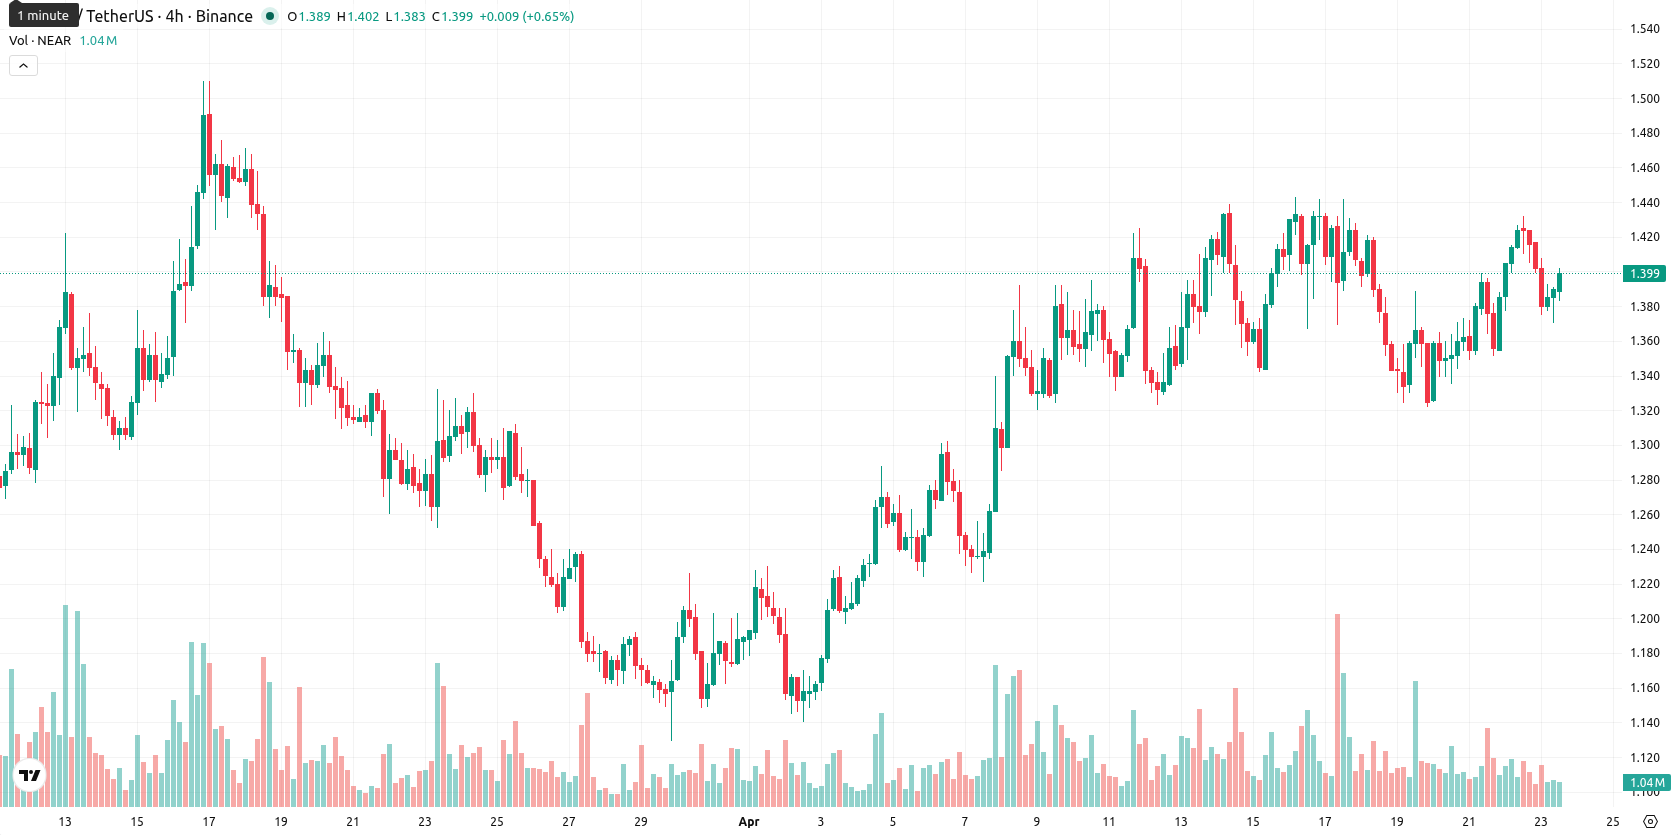
NEAR is trading at $1.399, currently positioned above the weekly MA-20 ($1.3471) but well below both the MA-50 ($2.0294) and MA-200 ($3,0927). Over the past week, NEAR rose $0.024, or 1.72%, with the price now sitting in the upper range of the weekly chart and recording a 9.08% volatility.
Highlights
- NEAR shows short-term buying momentum but trades well below key medium- and long-term resistance, signaling persistent bearish pressure.
- Momentum and trend indicators are largely mixed, with the balance of signals suggesting weak upward potential and overbought conditions.
- Price is forecast to oscillate between $1.25 and $1.53 in the coming week, with downside risk prevailing if selling resumes.
Bearish signals persist as resistance levels cap upside this week
Weekly technicals for NEAR remain mixed. Price sits comfortably above the MA-20 but continues to face notable resistance from the downward-sloping MA-50 and MA-200. Weekly support is located at $1.25, while resistance is seen near $1.53. Among oscillators, the RSI on the W1 chart is in neutral-to-bearish territory, the MACD reflects strong bearish momentum, and the Stochastic RSI points to overbought conditions. The ADX indicates a weak trend, and while the CCI is neutral, the Awesome Oscillator does not confirm bullish strength even as Bull/Bear Power suggests only a mild advantage to buyers.
Sideways outlook expected as breakout risks remain subdued
For the coming 7 days, NEAR is expected to consolidate within a range of $1.25 to $1.53, in line with recent volatility and current technical readings. The prognosis favors a sideways movement, as there is a low probability (less than 20%) for a breakout to the upside given the lack of Buy signals from major indicators. A bullish move would require a decisive close above $1.53, while a sustained push below $1.25 could trigger further selling. Traders should expect continued indecisive sentiment on the weekly timeframe.
Earlier, analysts noted that NEAR was experiencing sustained medium- and long-term resistance, with technical indicators pointing to continued indecisive sentiment. The latest market action reinforces this cautious outlook, and traders should monitor whether NEAR can maintain support above $1.25 as the asset remains vulnerable to volatility-driven swings.


Latest NEAR News


-
 Afghanistan
-
 Albania
-
 Algeria
-
 Angola
-
 Argentina
-
 Armenia
-
 Australia
-
 Austria
-
 Azerbaijan
-
 Bahamas
-
 Bahrain
-
 Bangladesh
-
 Belarus
-
 Belgium
-
 Bolivia
-
 Botswana
-
 Brazil
-
 Brunei
-
 Bulgaria
-
 Cambodia
-
 Cameroon
-
 Canada
-
 Chile
Chile
-
 China
China
-
 Colombia
-
 Congo
Congo
-
 Costa Rica
-
 Cote d'Ivoire
-
 Croatia
-
 Cuba
Cuba
-
 Cyprus
-
 Czechia
-
 DR Congo
-
 Denmark
-
 Dominican Republic
-
 Ecuador
-
 Egypt
Egypt
-
 El Salvador
-
 Estonia
-
 Eswatini
-
 Ethiopia
-
 Finland
-
 France
-
 Georgia
-
 Germany
-
 Ghana
Ghana
-
 Greece
-
 Haiti
Haiti
-
 Hong Kong
-
 Hungary
-
 India
India
-
 Indonesia
-
 Iran, Islamic republic
-
 Iraq
Iraq
-
 Ireland
-
 Israel
-
 Italy
Italy
-
 Jamaica
-
 Japan
Japan
-
 Jordan
-
 Kazakhstan
-
 Kenya
Kenya
-
 Korea
Korea
-
 Kuwait
-
 Kyrgyzstan
-
 Laos
Laos
-
 Latvia
-
 Lebanon
-
 Lesotho
-
 Libya
Libya
-
 Lithuania
-
 Luxembourg
-
 Madagascar
-
 Malaysia
-
 Malta
Malta
-
 Mauritius
-
 Mexico
-
 Moldova
-
 Mongolia
-
 Montenegro
-
 Morocco
-
 Mozambique
-
 Myanmar
-
 Namibia
-
 Nepal
Nepal
-
 Netherlands
-
 New Zealand
-
 Nigeria
-
 North Macedonia
-
 Norway
-
 Oman
Oman
-
 Pakistan
-
 Palestine
-
 Panama
-
 Papua New Guinea
-
 Paraguay
-
 Peru
Peru
-
 Philippines
-
 Poland
-
 Portugal
-
 Puerto Rico
-
 Qatar
Qatar
-
 Reunion
-
 Romania
-
 Rwanda
-
 Saudi Arabia
-
 Serbia
-
 Singapore
-
 Slovakia
-
 Slovenia
-
 Somalia
-
 South Africa
-
 Spain
Spain
-
 Sri Lanka
-
 Sweden
-
 Switzerland
-
 Syria
Syria
-
 Taiwan
-
 Tajikistan
-
 Tanzania
-
 Thailand
-
 Trinidad and Tobago
-
 Tunisia
-
 Turkey
-
 UAE
UAE
-
 Uganda
-
 Ukraine
-
 United Kingdom
-
United States
-
 Uruguay
-
 Uzbekistan
-
 Venezuela
-
 Vietnam
-
 Yemen
Yemen
-
 Zambia
-
 Zimbabwe
- Forex
- Crypto
