
NEAR up 3.94% as Stochastic RSI signals overbought conditions: weekly report

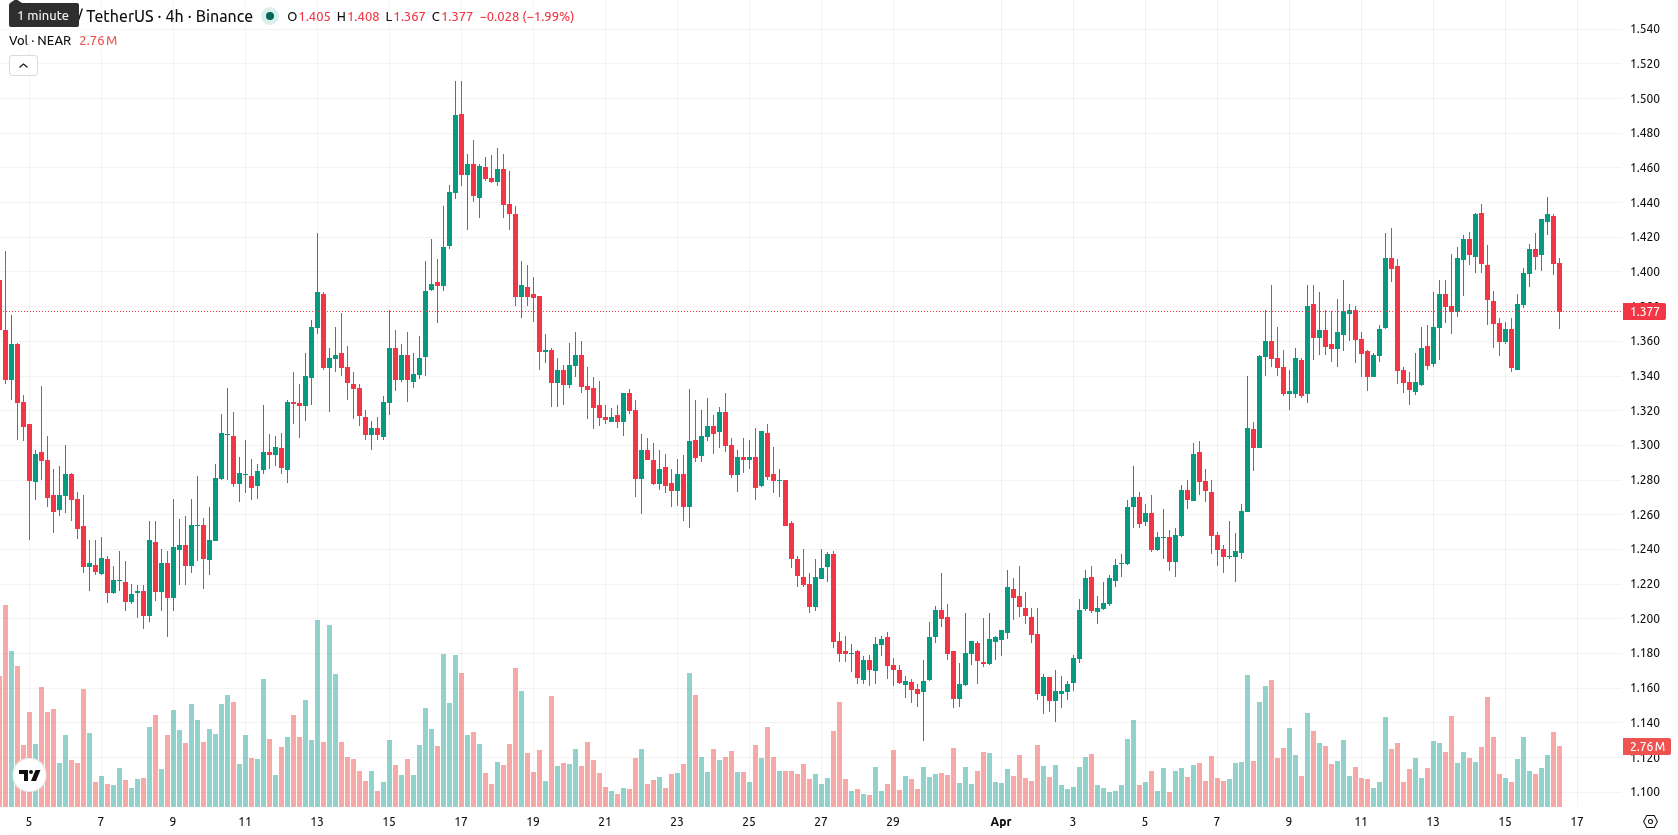
NEAR (NEAR) is currently trading at $1.3713, showing a weekly gain of $0.0453, or 3.94%. The asset sits slightly above its weekly MA-20 at $1.3662, but remains significantly below both the MA-50 ($2.0658) and MA-200 ($3.1051), reflecting short-term momentum but persistent medium- and long-term resistance.
Highlights
- NEAR consolidates between $1.25 and $1.49, with prevailing bearish momentum outweighing short-term gains.
- Technical indicators collectively signal a weak trend, featuring subdued momentum and overbought conditions despite mild price recovery.
- Probability of sustained upward movement remains under 20%, while a break below $1.25 could trigger additional downside.
Conflicted momentum and elevated volatility as weekly indicators diverge
On the weekly chart, NEAR shows mixed technical signals. The price is supported by the MA-20 but faces major resistance at the MA-50 and MA-200 levels. Weekly indicators are conflicted: the MACD points to strong bearish momentum, the ADX indicates a weak trend, and the RSI suggests mild selling pressure. Stochastic RSI is overbought while the CCI reads neutral, and positive Bull/Bear Power signals buyer interest but is offset by bearish momentum from most indicators. Weekly volatility remains elevated at 8.77%, with NEAR trading in the middle of its recent range and finding dynamic support at the MA-20.
Sideways consolidation likely as breakout chances remain limited this week
For the next 7 days, NEAR is likely to consolidate within a range of $1.25 to $1.49, mirroring its current weekly volatility and price action. The probability of a sustained upward breakout above $1.49 is low (less than 20%) as none of the four key momentum indicators display a buy signal, while downside risks persist due to prevailing longer-term resistance. Should price drop below $1.25, further declines are likely, in line with the bearish medium- and long-term technical backdrop. The base case calls for sideways trading as conflicting weekly indicators reflect indecisive sentiment.
Earlier, analysts noted that NEAR was under persistent medium- and long-term selling pressure, with a cautious outlook prevailing despite occasional rallies. Current developments reinforce this perspective, highlighting the importance of monitoring whether NEAR can maintain support above its MA-20 and signaling that any decisive move beyond recent volatility could set the tone for the next directional trend.


Latest NEAR News


-
 Afghanistan
-
 Albania
-
 Algeria
-
 Angola
-
 Argentina
-
 Armenia
-
 Australia
-
 Austria
-
 Azerbaijan
-
 Bahamas
-
 Bahrain
-
 Bangladesh
-
 Belarus
-
 Belgium
-
 Bolivia
-
 Botswana
-
 Brazil
-
 Brunei
-
 Bulgaria
-
 Cambodia
-
 Cameroon
-
 Canada
-
 Chile
Chile
-
 China
China
-
 Colombia
-
 Congo
Congo
-
 Costa Rica
-
 Cote d'Ivoire
-
 Croatia
-
 Cuba
Cuba
-
 Cyprus
-
 Czechia
-
 DR Congo
-
 Denmark
-
 Dominican Republic
-
 Ecuador
-
 Egypt
Egypt
-
 El Salvador
-
 Estonia
-
 Eswatini
-
 Ethiopia
-
 Finland
-
 France
-
 Georgia
-
 Germany
-
 Ghana
Ghana
-
 Greece
-
 Haiti
Haiti
-
 Hong Kong
-
 Hungary
-
 India
India
-
 Indonesia
-
 Iran, Islamic republic
-
 Iraq
Iraq
-
 Ireland
-
 Israel
-
 Italy
Italy
-
 Jamaica
-
 Japan
Japan
-
 Jordan
-
 Kazakhstan
-
 Kenya
Kenya
-
 Korea
Korea
-
 Kuwait
-
 Kyrgyzstan
-
 Laos
Laos
-
 Latvia
-
 Lebanon
-
 Lesotho
-
 Libya
Libya
-
 Lithuania
-
 Luxembourg
-
 Madagascar
-
 Malaysia
-
 Malta
Malta
-
 Mauritius
-
 Mexico
-
 Moldova
-
 Mongolia
-
 Montenegro
-
 Morocco
-
 Mozambique
-
 Myanmar
-
 Namibia
-
 Nepal
Nepal
-
 Netherlands
-
 New Zealand
-
 Nigeria
-
 North Macedonia
-
 Norway
-
 Oman
Oman
-
 Pakistan
-
 Palestine
-
 Panama
-
 Papua New Guinea
-
 Paraguay
-
 Peru
Peru
-
 Philippines
-
 Poland
-
 Portugal
-
 Puerto Rico
-
 Qatar
Qatar
-
 Reunion
-
 Romania
-
 Rwanda
-
 Saudi Arabia
-
 Serbia
-
 Singapore
-
 Slovakia
-
 Slovenia
-
 Somalia
-
 South Africa
-
 Spain
Spain
-
 Sri Lanka
-
 Sweden
-
 Switzerland
-
 Syria
Syria
-
 Taiwan
-
 Tajikistan
-
 Tanzania
-
 Thailand
-
 Trinidad and Tobago
-
 Tunisia
-
 Turkey
-
 UAE
UAE
-
 Uganda
-
 Ukraine
-
 United Kingdom
-
United States
-
 Uruguay
-
 Uzbekistan
-
 Venezuela
-
 Vietnam
-
 Yemen
Yemen
-
 Zambia
-
 Zimbabwe
- Forex
- Crypto
