
NEAR up 15.62% supported by strength near $1.30–$1.40 range: weekly review

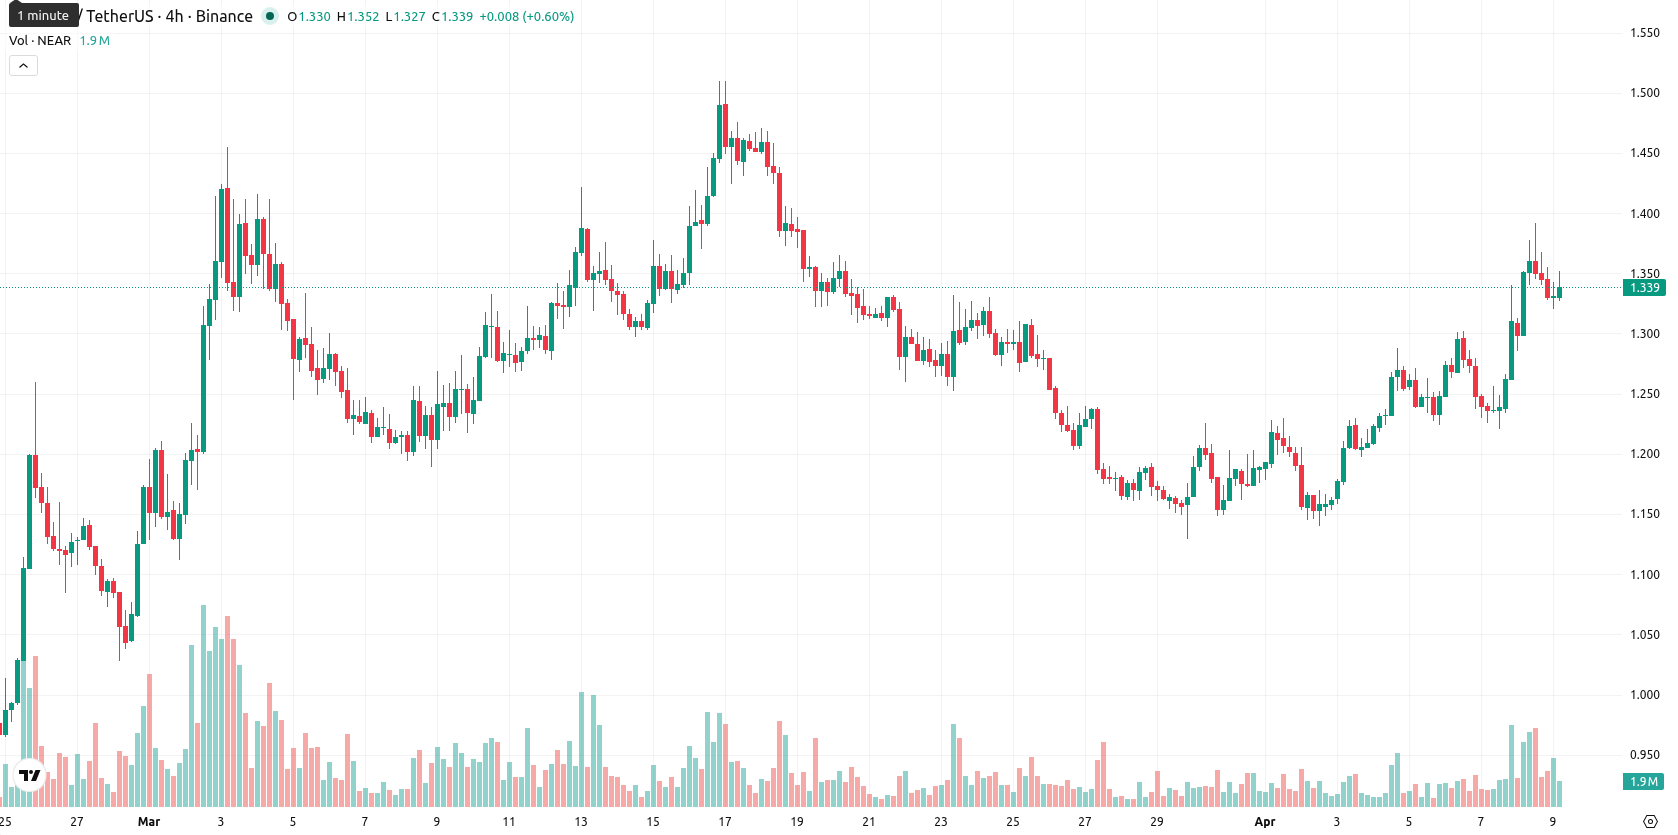
NEAR is currently trading at $1.3396, which reflects a weekly gain of $0.1806 or 15.62%. The price remains below the weekly MA-20 ($1.3852), MA-50 ($2.0837), and MA-200 ($3.1144), confirming ongoing medium- and long-term pressure from sellers despite a strong rally. NEAR finished the week in the upper sector of its range.
Highlights
- NEAR trades below major moving averages, signaling prolonged bearish pressure from medium- and long-term sellers.
- Momentum indicators are largely neutral to bearish, with no major buy signals and evidence of near-term exhaustion.
- The expected price range for NEAR this week is $1.30–$1.40, with consolidation likely and risk skewed toward a potential decline.
Volatility and exhaustion as momentum signals diverge over the week
On the weekly chart, NEAR is trading below all major moving averages — MA-20, MA-50, and MA-200 — positioning the MA-20 as the closest dynamic resistance level. The Ichimoku Kijun line is also well above the current price, further highlighting overhead barriers. Weekly momentum is mixed: while MACD signals strong bearish momentum, ADX suggests a lack of trend strength. The RSI is in weak territory, Stochastic RSI indicates overbought conditions, and CCI remains neutral. Bull/Bear Power points to a slight advantage for buyers, but the overall tone is one of volatility and exhaustion after the sharp rally, with a 20.21% weekly volatility and divergence visible between price action and momentum indicators. Key weekly support is found just below $1.30, with resistance at $1.40.
Sideways outlook with limited breakout risk in the coming week
For the next 7 days, NEAR is expected to consolidate around current levels, trading between $1.30 and $1.40. The probability of further upside is very low — less than 20% — with none of the four key W1 momentum indicators generating a buy or strong buy signal. The base scenario is a sideways move; if buyers regain momentum, a bullish breakout above $1.40 is possible. Renewed selling could push NEAR below $1.30 to test dynamic supports.
Previously it was reported that NEAR faced persistent selling pressure and downside risk despite intermittent rallies. The current analysis affirms this cautious outlook, with technical signals suggesting that traders should closely monitor the $1.30–$1.40 range as consolidation is likely and any decisive move outside this band could set the next directional trend.


Latest NEAR News


-
 Afghanistan
-
 Albania
-
 Algeria
-
 Angola
-
 Argentina
-
 Armenia
-
 Australia
-
 Austria
-
 Azerbaijan
-
 Bahamas
-
 Bahrain
-
 Bangladesh
-
 Belarus
-
 Belgium
-
 Bolivia
-
 Botswana
-
 Brazil
-
 Brunei
-
 Bulgaria
-
 Cambodia
-
 Cameroon
-
 Canada
-
 Chile
Chile
-
 China
China
-
 Colombia
-
 Congo
Congo
-
 Costa Rica
-
 Cote d'Ivoire
-
 Croatia
-
 Cuba
Cuba
-
 Cyprus
-
 Czechia
-
 DR Congo
-
 Denmark
-
 Dominican Republic
-
 Ecuador
-
 Egypt
Egypt
-
 El Salvador
-
 Estonia
-
 Eswatini
-
 Ethiopia
-
 Finland
-
 France
-
 Georgia
-
 Germany
-
 Ghana
Ghana
-
 Greece
-
 Haiti
Haiti
-
 Hong Kong
-
 Hungary
-
 India
India
-
 Indonesia
-
 Iran, Islamic republic
-
 Iraq
Iraq
-
 Ireland
-
 Israel
-
 Italy
Italy
-
 Jamaica
-
 Japan
Japan
-
 Jordan
-
 Kazakhstan
-
 Kenya
Kenya
-
 Korea
Korea
-
 Kuwait
-
 Kyrgyzstan
-
 Laos
Laos
-
 Latvia
-
 Lebanon
-
 Lesotho
-
 Libya
Libya
-
 Lithuania
-
 Luxembourg
-
 Madagascar
-
 Malaysia
-
 Malta
Malta
-
 Mauritius
-
 Mexico
-
 Moldova
-
 Mongolia
-
 Montenegro
-
 Morocco
-
 Mozambique
-
 Myanmar
-
 Namibia
-
 Nepal
Nepal
-
 Netherlands
-
 New Zealand
-
 Nigeria
-
 North Macedonia
-
 Norway
-
 Oman
Oman
-
 Pakistan
-
 Palestine
-
 Panama
-
 Papua New Guinea
-
 Paraguay
-
 Peru
Peru
-
 Philippines
-
 Poland
-
 Portugal
-
 Puerto Rico
-
 Qatar
Qatar
-
 Reunion
-
 Romania
-
 Rwanda
-
 Saudi Arabia
-
 Serbia
-
 Singapore
-
 Slovakia
-
 Slovenia
-
 Somalia
-
 South Africa
-
 Spain
Spain
-
 Sri Lanka
-
 Sweden
-
 Switzerland
-
 Syria
Syria
-
 Taiwan
-
 Tajikistan
-
 Tanzania
-
 Thailand
-
 Trinidad and Tobago
-
 Tunisia
-
 Turkey
-
 UAE
UAE
-
 Uganda
-
 Ukraine
-
 United Kingdom
-
United States
-
 Uruguay
-
 Uzbekistan
-
 Venezuela
-
 Vietnam
-
 Yemen
Yemen
-
 Zambia
-
 Zimbabwe
- Forex
- Crypto
