
Pendle jumps 10.11% as buying momentum slows near long-term average

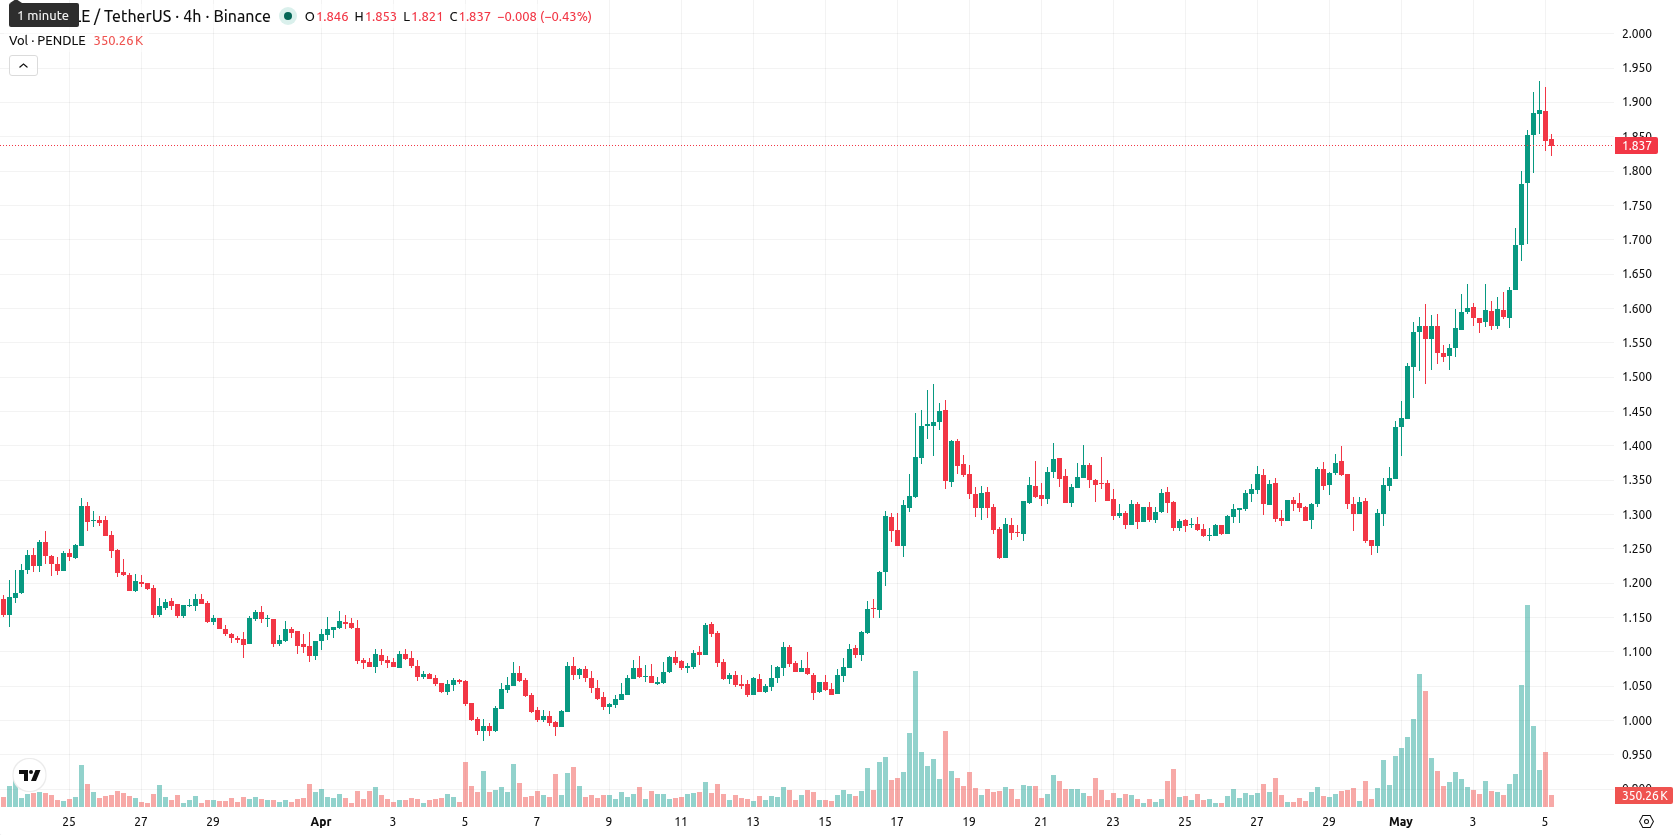
Pendle (PENDLE) is trading at $1.84, up 10.11% on the day and positioned above its key short- and medium-term moving averages, while staying just below its long-term average.
Highlights
- PENDLE shows persistent bullish momentum, trading well above short- and medium-term averages but encountering resistance near $1.85.
- Multiple momentum indicators signal overbought conditions, warning of potential short-term froth despite ongoing strength.
- The expected range for the coming week is $1.81–$1.84, with consolidation likely and a greater probability of a pullback than further upside.
Bullish momentum persists as overbought signals prompt caution
Technically, PENDLE is trading well above the MA-20 ($1.3834) and MA-50 ($1.2424), but just under the MA-200 ($1.8509), with the D1 Ichimoku Kijun providing immediate support at $1.4700. Today's session opened with a gap from $1.671 to $1.887, and current trading is concentrated near the upper end of the $1.821–$1.922 range, reflecting high volatility. Momentum readings are strong: MACD and ADX signal an uptrend, while RSI at 79.24, Stoch RSI at 100, and elevated CCI point to overbought conditions. The positive BBP reading and an active Awesome Oscillator confirm persistent bullish strength, but several oscillators indicate the rally may be overextended in the short term.
Consolidation risk grows as upside probability stays limited
For the next week, PENDLE is expected to trade within a $1.81–$1.84 volatility band relative to current levels. The probability of a price increase over the next five days remains very low (less than 20%), raising the likelihood of a consolidation or pullback due to prevailing negative weekly signals. A sideways channel around $1.82–$1.84 is the baseline scenario, while a bullish breakout above $1.85 may develop if renewed buying interest emerges. Conversely, a break below $1.81 could follow swift profit-taking as traders react to overbought signals.
Earlier, analysts noted that Pendle was exhibiting strong bullish momentum but remained vulnerable to potential technical pullbacks amid heightened volatility. The current technical picture reinforces this view, with overbought signals and a constrained volatility band suggesting traders should monitor for a consolidation phase or swift reversal around the $1.81–$1.84 range.


-
 Afghanistan
-
 Albania
-
 Algeria
-
 Angola
-
 Argentina
-
 Armenia
-
 Australia
-
 Austria
-
 Azerbaijan
-
 Bahamas
-
 Bahrain
-
 Bangladesh
-
 Belarus
-
 Belgium
-
 Bolivia
-
 Botswana
-
 Brazil
-
 Brunei
-
 Bulgaria
-
 Cambodia
-
 Cameroon
-
 Canada
-
 Chile
Chile
-
 China
China
-
 Colombia
-
 Congo
Congo
-
 Costa Rica
-
 Cote d'Ivoire
-
 Croatia
-
 Cuba
Cuba
-
 Cyprus
-
 Czechia
-
 DR Congo
-
 Denmark
-
 Dominican Republic
-
 Ecuador
-
 Egypt
Egypt
-
 El Salvador
-
 Estonia
-
 Eswatini
-
 Ethiopia
-
 Finland
-
 France
-
 Georgia
-
 Germany
-
 Ghana
Ghana
-
 Greece
-
 Haiti
Haiti
-
 Hong Kong
-
 Hungary
-
 India
India
-
 Indonesia
-
 Iran, Islamic republic
-
 Iraq
Iraq
-
 Ireland
-
 Israel
-
 Italy
Italy
-
 Jamaica
-
 Japan
Japan
-
 Jordan
-
 Kazakhstan
-
 Kenya
Kenya
-
 Korea
Korea
-
 Kuwait
-
 Kyrgyzstan
-
 Laos
Laos
-
 Latvia
-
 Lebanon
-
 Lesotho
-
 Libya
Libya
-
 Lithuania
-
 Luxembourg
-
 Madagascar
-
 Malaysia
-
 Malta
Malta
-
 Mauritius
-
 Mexico
-
 Moldova
-
 Mongolia
-
 Montenegro
-
 Morocco
-
 Mozambique
-
 Myanmar
-
 Namibia
-
 Nepal
Nepal
-
 Netherlands
-
 New Zealand
-
 Nigeria
-
 North Macedonia
-
 Norway
-
 Oman
Oman
-
 Pakistan
-
 Palestine
-
 Panama
-
 Papua New Guinea
-
 Paraguay
-
 Peru
Peru
-
 Philippines
-
 Poland
-
 Portugal
-
 Puerto Rico
-
 Qatar
Qatar
-
 Reunion
-
 Romania
-
 Rwanda
-
 Saudi Arabia
-
 Serbia
-
 Singapore
-
 Slovakia
-
 Slovenia
-
 Somalia
-
 South Africa
-
 Spain
Spain
-
 Sri Lanka
-
 Sweden
-
 Switzerland
-
 Syria
Syria
-
 Taiwan
-
 Tajikistan
-
 Tanzania
-
 Thailand
-
 Trinidad and Tobago
-
 Tunisia
-
 Turkey
-
 UAE
UAE
-
 Uganda
-
 Ukraine
-
 United Kingdom
-
United States
-
 Uruguay
-
 Uzbekistan
-
 Venezuela
-
 Vietnam
-
 Yemen
Yemen
-
 Zambia
-
 Zimbabwe
- Forex
- Crypto
