
-7.33% for The Graph as price slips below short-term averages

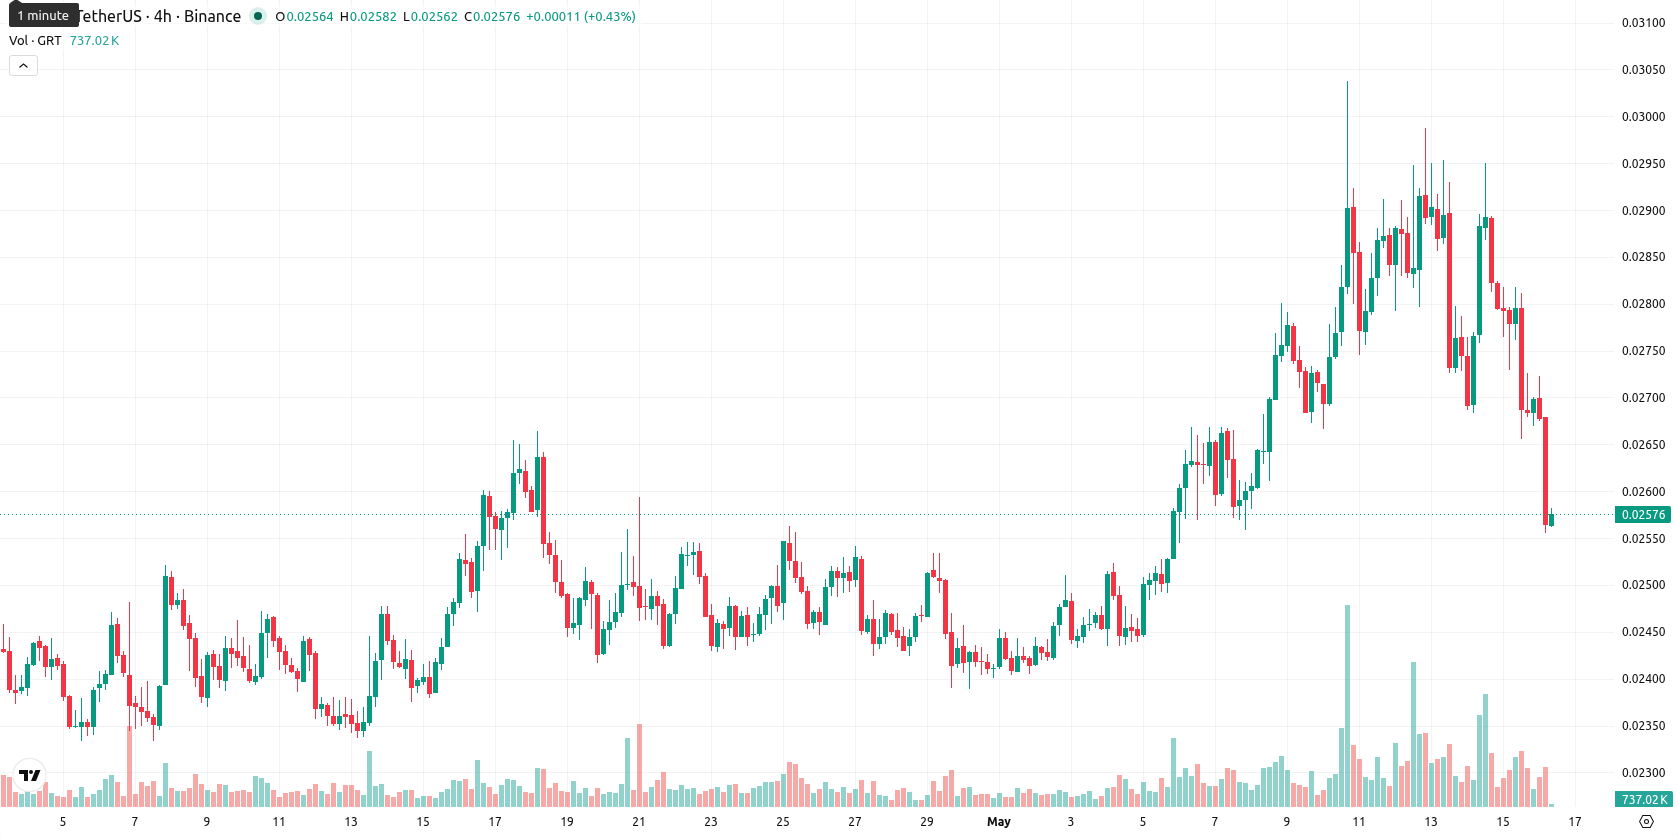
The Graph (GRT) is trading at $0.02578, down 7.33% on the day and positioned just below its short-term moving averages while remaining above longer-range averages. The asset currently sits near the low end of today's range, indicating heightened intraday volatility.
Highlights
- The Graph received increased attention as a leading decentralized indexing solution, fostering greater Web3 developer engagement and ecosystem relevance.
- Despite positive infrastructure coverage and rising awareness, GRT’s price remained constrained by broader crypto market selling pressure.
- Technical outlook is bearish near term, with high volatility and a likely trading range of $0.02400 to $0.02750 for the week ahead.
Ecosystem engagement broadens as infrastructure report boosts awareness
On May 15, a published infrastructure report described The Graph as a primary decentralized indexing protocol enabling blockchain data tools for developers and applications across the Web3 ecosystem. The visibility from this coverage emphasized the protocol's technical capabilities and its relevance for enabling decentralized analytics. These factors have supported broader ecosystem awareness and developer engagement, though price action has remained under broader selling pressure.
Bullish momentum persists amid volatile test of technical support
Technically, GRT’s key levels are defined by the SMA-20 at $0.02612, SMA-50 at $0.02506, and SMA-200 at $0.03555, with a D1 Ichimoku Kijun resistance at $0.02714. Short-term support is visible near $0.02500 and resistance at $0.02750. MACD and ADX on the daily timeframe indicate underlying bullish momentum, while RSI and CCI are mildly upward but remain unextended. The Stoch RSI is neutral on D1 and oversold on intraday frames, and Bull/Bear Power shows daily buyer dominance but with lower timeframe bearishness. The current price near intraday lows and increased volatility underscores the risk of further pullbacks.
Further downside risk grows as weekly bearish bias prevails
Over the coming week, GRT is expected to trade within a $0.02400 to $0.02750 band, reflecting typical volatility relative to current levels. The likelihood of an upward move remains below 20%, with further downside favored as bearish signals persist across weekly moving averages and oscillators. Baseline scenario anticipates a sideways range with contested momentum; if GRT clears $0.02714, short covering could push towards $0.02750, but a breakdown below $0.02500 would likely expose support at $0.02400.
Earlier, analysts noted that The Graph remained under sustained bearish pressure, with little evidence of a shift in momentum. The latest combination of heightened intraday volatility, persistent downside bias across timeframes, and a sub-20% probability of a breakout underscores the importance of monitoring the $0.02714 resistance and $0.02500 support as pivotal levels for the coming week.


-
 Afghanistan
-
 Albania
-
 Algeria
-
 Angola
-
 Argentina
-
 Armenia
-
 Australia
-
 Austria
-
 Azerbaijan
-
 Bahamas
-
 Bahrain
-
 Bangladesh
-
 Belarus
-
 Belgium
-
 Bolivia
-
 Botswana
-
 Brazil
-
 Brunei
-
 Bulgaria
-
 Cambodia
-
 Cameroon
-
 Canada
-
 Chile
Chile
-
 China
China
-
 Colombia
-
 Congo
Congo
-
 Costa Rica
-
 Cote d'Ivoire
-
 Croatia
-
 Cuba
Cuba
-
 Cyprus
-
 Czechia
-
 DR Congo
-
 Denmark
-
 Dominican Republic
-
 Ecuador
-
 Egypt
Egypt
-
 El Salvador
-
 Estonia
-
 Eswatini
-
 Ethiopia
-
 Finland
-
 France
-
 Georgia
-
 Germany
-
 Ghana
Ghana
-
 Greece
-
 Haiti
Haiti
-
 Hong Kong
-
 Hungary
-
 India
India
-
 Indonesia
-
 Iran, Islamic republic
-
 Iraq
Iraq
-
 Ireland
-
 Israel
-
 Italy
Italy
-
 Jamaica
-
 Japan
Japan
-
 Jordan
-
 Kazakhstan
-
 Kenya
Kenya
-
 Korea
Korea
-
 Kuwait
-
 Kyrgyzstan
-
 Laos
Laos
-
 Latvia
-
 Lebanon
-
 Lesotho
-
 Libya
Libya
-
 Lithuania
-
 Luxembourg
-
 Madagascar
-
 Malaysia
-
 Malta
Malta
-
 Mauritius
-
 Mexico
-
 Moldova
-
 Mongolia
-
 Montenegro
-
 Morocco
-
 Mozambique
-
 Myanmar
-
 Namibia
-
 Nepal
Nepal
-
 Netherlands
-
 New Zealand
-
 Nigeria
-
 North Macedonia
-
 Norway
-
 Oman
Oman
-
 Pakistan
-
 Palestine
-
 Panama
-
 Papua New Guinea
-
 Paraguay
-
 Peru
Peru
-
 Philippines
-
 Poland
-
 Portugal
-
 Puerto Rico
-
 Qatar
Qatar
-
 Reunion
-
 Romania
-
 Rwanda
-
 Saudi Arabia
-
 Serbia
-
 Singapore
-
 Slovakia
-
 Slovenia
-
 Somalia
-
 South Africa
-
 Spain
Spain
-
 Sri Lanka
-
 Sweden
-
 Switzerland
-
 Syria
Syria
-
 Taiwan
-
 Tajikistan
-
 Tanzania
-
 Thailand
-
 Trinidad and Tobago
-
 Tunisia
-
 Turkey
-
 UAE
UAE
-
 Uganda
-
 Ukraine
-
 United Kingdom
-
United States
-
 Uruguay
-
 Uzbekistan
-
 Venezuela
-
 Vietnam
-
 Yemen
Yemen
-
 Zambia
-
 Zimbabwe
- Forex
- Crypto
