
Pendle extends gains as momentum holds above key moving averages

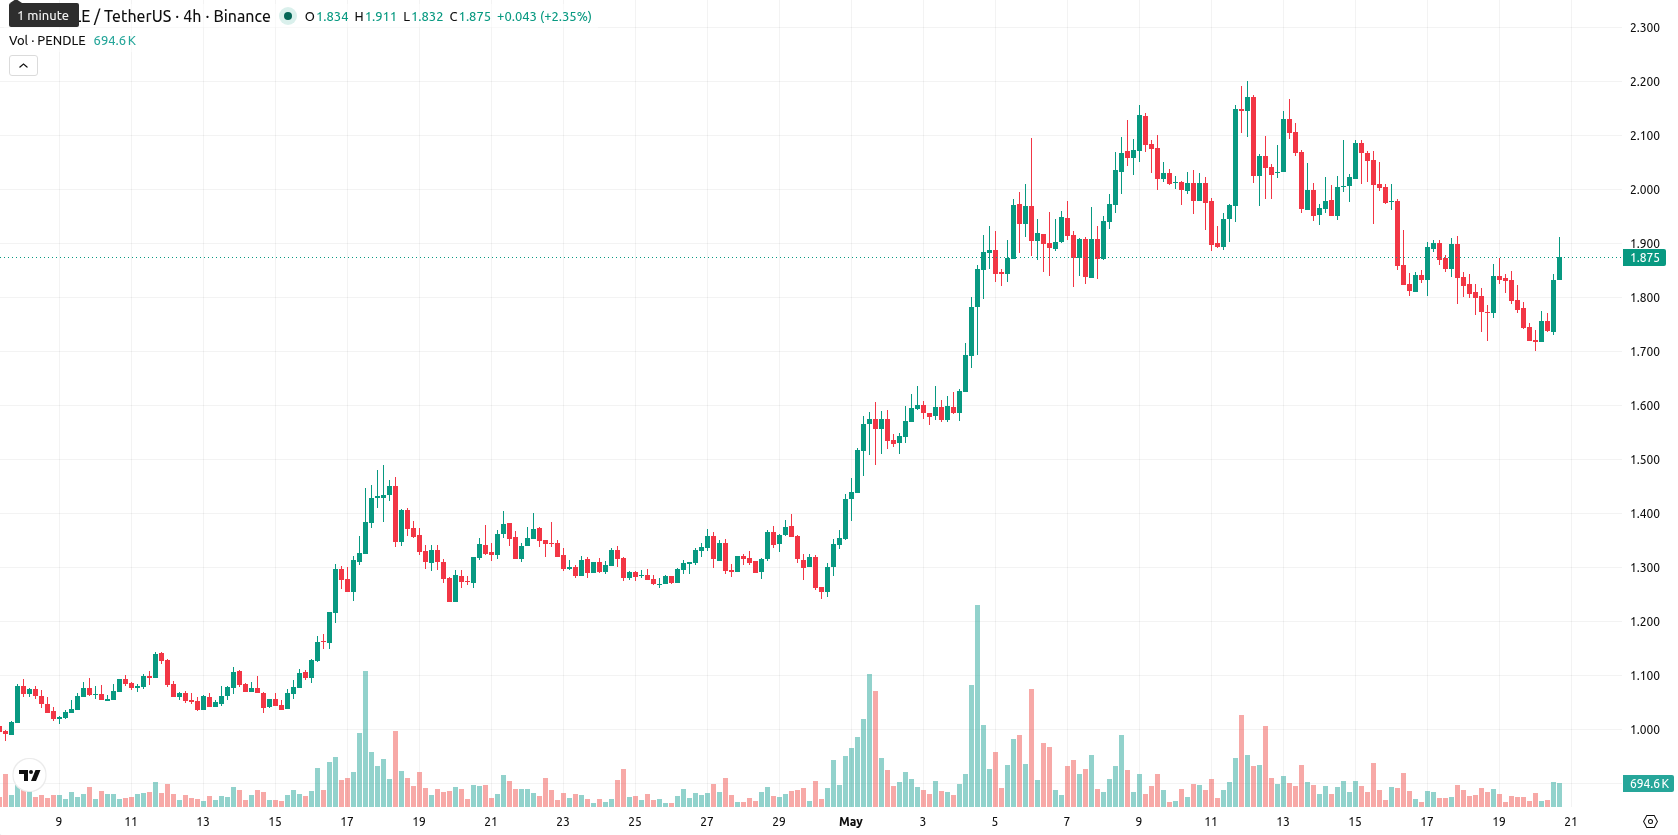
Pendle (PENDLE) is trading at $1.892, up 7.32% on the day, and is positioned above its key moving averages, indicating near-term stability and underlying strength.
Highlights
- PENDLE is trading at $1.892, exhibiting short-term stability and strong medium- to long-term technical support.
- Momentum remains strong with a bullish bias, but momentum oscillators are signaling mild exhaustion and potential for profit-taking.
- Price is expected to consolidate between $1.753 and $2.044 in the coming week, with upside probability below 20% and a higher likelihood of a pullback.
Mixed momentum as strong trend counters overbought signals
PENDLE is trading above the SMA-20 ($1.8646), SMA-200 ($1.7579), and remains well above the SMA-50 ($1.4589). The Ichimoku Kijun level at $1.7210 provides immediate support below current price. On the momentum side, the MACD (D1) signals a strong buy, with the ADX at 39.71 reflecting robust trend activity. Despite these signs of strength, the RSI reads at 49.19, pointing to neutral-to-weak conditions, and the Stoch RSI is currently oversold. The CCI indicator remains neutral, BBP shows mild buyer dominance, and the Awesome Oscillator is in neutral territory. Today’s high volatility and price action near the daily high signal persistent strength after the open, though oscillators suggest some potential for short-term exhaustion and profit-taking.
Sideways bias as bearish risks grow on waning momentum
Looking ahead to the coming week, PENDLE is expected to trade within a typical volatility range of $1.753 to $2.044. The probability of a further price increase is very low (below 20%), while a decrease is seen as more likely given current momentum and oscillator dynamics. The most probable scenario is sideways consolidation between these support and resistance levels, with a bullish move needing a break above $2.044 and a bearish shift brought on by a move below $1.753, potentially triggering tests of deeper support if buyer momentum fades.
Earlier, analysts noted that while Pendle sustained buyer strength, the risk of near-term consolidation and a potential shift in trend had increased amidst mixed technical signals. The latest market data confirms ongoing consolidation as the dominant scenario, but with volatility high and oscillators flagging profit-taking risk, traders should closely watch for a decisive breakout above resistance or deeper downside should momentum wane.


-
 Afghanistan
-
 Albania
-
 Algeria
-
 Angola
-
 Argentina
-
 Armenia
-
 Australia
-
 Austria
-
 Azerbaijan
-
 Bahamas
-
 Bahrain
-
 Bangladesh
-
 Belarus
-
 Belgium
-
 Bolivia
-
 Botswana
-
 Brazil
-
 Brunei
-
 Bulgaria
-
 Cambodia
-
 Cameroon
-
 Canada
-
 Chile
Chile
-
 China
China
-
 Colombia
-
 Congo
Congo
-
 Costa Rica
-
 Cote d'Ivoire
-
 Croatia
-
 Cuba
Cuba
-
 Cyprus
-
 Czechia
-
 DR Congo
-
 Denmark
-
 Dominican Republic
-
 Ecuador
-
 Egypt
Egypt
-
 El Salvador
-
 Estonia
-
 Eswatini
-
 Ethiopia
-
 Finland
-
 France
-
 Georgia
-
 Germany
-
 Ghana
Ghana
-
 Greece
-
 Haiti
Haiti
-
 Hong Kong
-
 Hungary
-
 India
India
-
 Indonesia
-
 Iran, Islamic republic
-
 Iraq
Iraq
-
 Ireland
-
 Israel
-
 Italy
Italy
-
 Jamaica
-
 Japan
Japan
-
 Jordan
-
 Kazakhstan
-
 Kenya
Kenya
-
 Korea
Korea
-
 Kuwait
-
 Kyrgyzstan
-
 Laos
Laos
-
 Latvia
-
 Lebanon
-
 Lesotho
-
 Libya
Libya
-
 Lithuania
-
 Luxembourg
-
 Madagascar
-
 Malaysia
-
 Malta
Malta
-
 Mauritius
-
 Mexico
-
 Moldova
-
 Mongolia
-
 Montenegro
-
 Morocco
-
 Mozambique
-
 Myanmar
-
 Namibia
-
 Nepal
Nepal
-
 Netherlands
-
 New Zealand
-
 Nigeria
-
 North Macedonia
-
 Norway
-
 Oman
Oman
-
 Pakistan
-
 Palestine
-
 Panama
-
 Papua New Guinea
-
 Paraguay
-
 Peru
Peru
-
 Philippines
-
 Poland
-
 Portugal
-
 Puerto Rico
-
 Qatar
Qatar
-
 Reunion
-
 Romania
-
 Rwanda
-
 Saudi Arabia
-
 Serbia
-
 Singapore
-
 Slovakia
-
 Slovenia
-
 Somalia
-
 South Africa
-
 Spain
Spain
-
 Sri Lanka
-
 Sweden
-
 Switzerland
-
 Syria
Syria
-
 Taiwan
-
 Tajikistan
-
 Tanzania
-
 Thailand
-
 Trinidad and Tobago
-
 Tunisia
-
 Turkey
-
 UAE
UAE
-
 Uganda
-
 Ukraine
-
 United Kingdom
-
United States
-
 Uruguay
-
 Uzbekistan
-
 Venezuela
-
 Vietnam
-
 Yemen
Yemen
-
 Zambia
-
 Zimbabwe
- Forex
- Crypto
