
Sharp upside gap lifts Pendle to a strong session gain

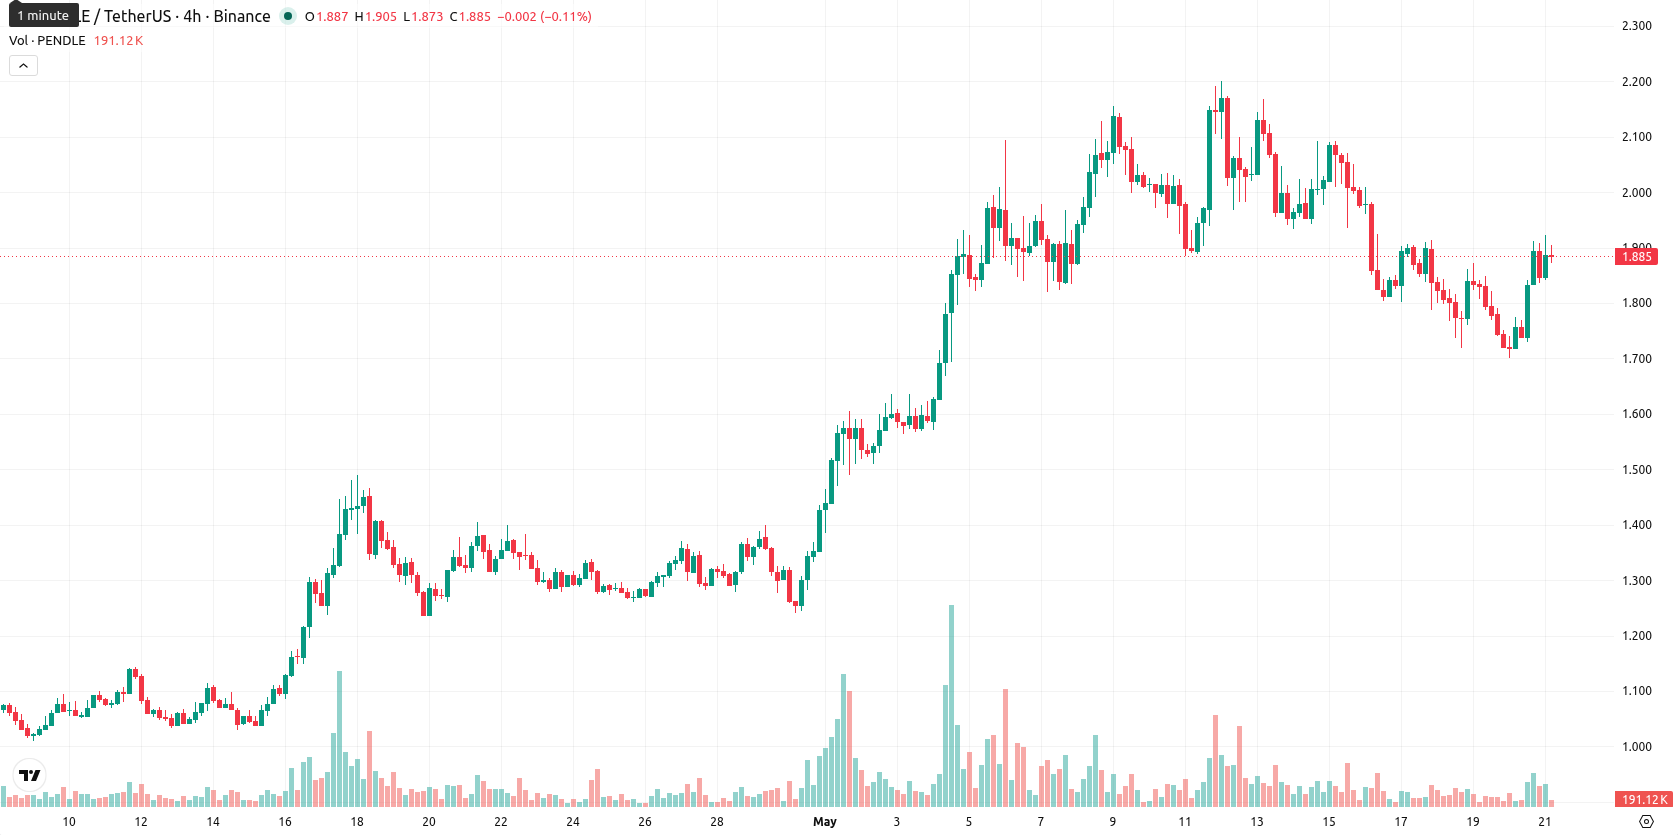
Pendle (PENDLE) is trading at $1.895 after rising 7.73% on the day, currently positioned just above its key moving averages. Today’s performance reflects a strong daily move and positions the asset near the upper end of its recent range.
Highlights
- PENDLE's price remains firmly above short-, medium-, and long-term support levels, confirming bullish structural positioning.
- Momentum and trend indicators signal ongoing strength, with strong daily gains and intraday volatility reinforcing buyer control.
- Price is expected to consolidate within a $1.82–$2.11 range over the next five days, with a higher probability of downward movement unless key resistance breaks.
Upside gap and robust momentum as buyers dominate session
On the technical front, PENDLE is just above the SMA-20 at $1.8879, sharply above the SMA-50 at $1.4744, and remains well above the SMA-200 at $1.7517. Immediate support is defined by the Ichimoku Kijun level at $1.7210. Technical momentum is robust: MACD delivers a strong buy signal and ADX confirms an active uptrend. The RSI stands at 56.8, indicating neutral-bullish conditions, while Stoch RSI points to strong buying interest and CCI stays neutral. Bull/Bear Power (BBP) data highlights firm intraday buyer dominance, and the price opened with a significant upside gap from $1.759 to $1.846. The session is marked by high volatility and continuing strength toward session highs.
Sideways scenario likely as breakout potential remains limited
For the coming five trading days, PENDLE is expected to fluctuate within a typical volatility band of $1.82 to $2.11. Based on the combination of daily and weekly signals, the probability of further price increase is low, with less than a 20% chance of a breakout higher. The baseline scenario envisions PENDLE holding within a broad sideways channel; a bullish breakout would require a clean move above $2.11 resistance, while a bearish scenario could emerge on a drop below $1.82 support.
Earlier, analysts noted that while Pendle was demonstrating notable buyer strength, mixed technical signals suggested a potential period of consolidation. With the latest uptick in price and persistent volatility, traders should monitor for a sustained push beyond the $2.11 resistance as a sign of renewed bullish momentum.


-
 Afghanistan
-
 Albania
-
 Algeria
-
 Angola
-
 Argentina
-
 Armenia
-
 Australia
-
 Austria
-
 Azerbaijan
-
 Bahamas
-
 Bahrain
-
 Bangladesh
-
 Belarus
-
 Belgium
-
 Bolivia
-
 Botswana
-
 Brazil
-
 Brunei
-
 Bulgaria
-
 Cambodia
-
 Cameroon
-
 Canada
-
 Chile
Chile
-
 China
China
-
 Colombia
-
 Congo
Congo
-
 Costa Rica
-
 Cote d'Ivoire
-
 Croatia
-
 Cuba
Cuba
-
 Cyprus
-
 Czechia
-
 DR Congo
-
 Denmark
-
 Dominican Republic
-
 Ecuador
-
 Egypt
Egypt
-
 El Salvador
-
 Estonia
-
 Eswatini
-
 Ethiopia
-
 Finland
-
 France
-
 Georgia
-
 Germany
-
 Ghana
Ghana
-
 Greece
-
 Haiti
Haiti
-
 Hong Kong
-
 Hungary
-
 India
India
-
 Indonesia
-
 Iran, Islamic republic
-
 Iraq
Iraq
-
 Ireland
-
 Israel
-
 Italy
Italy
-
 Jamaica
-
 Japan
Japan
-
 Jordan
-
 Kazakhstan
-
 Kenya
Kenya
-
 Korea
Korea
-
 Kuwait
-
 Kyrgyzstan
-
 Laos
Laos
-
 Latvia
-
 Lebanon
-
 Lesotho
-
 Libya
Libya
-
 Lithuania
-
 Luxembourg
-
 Madagascar
-
 Malaysia
-
 Malta
Malta
-
 Mauritius
-
 Mexico
-
 Moldova
-
 Mongolia
-
 Montenegro
-
 Morocco
-
 Mozambique
-
 Myanmar
-
 Namibia
-
 Nepal
Nepal
-
 Netherlands
-
 New Zealand
-
 Nigeria
-
 North Macedonia
-
 Norway
-
 Oman
Oman
-
 Pakistan
-
 Palestine
-
 Panama
-
 Papua New Guinea
-
 Paraguay
-
 Peru
Peru
-
 Philippines
-
 Poland
-
 Portugal
-
 Puerto Rico
-
 Qatar
Qatar
-
 Reunion
-
 Romania
-
 Rwanda
-
 Saudi Arabia
-
 Serbia
-
 Singapore
-
 Slovakia
-
 Slovenia
-
 Somalia
-
 South Africa
-
 Spain
Spain
-
 Sri Lanka
-
 Sweden
-
 Switzerland
-
 Syria
Syria
-
 Taiwan
-
 Tajikistan
-
 Tanzania
-
 Thailand
-
 Trinidad and Tobago
-
 Tunisia
-
 Turkey
-
 UAE
UAE
-
 Uganda
-
 Ukraine
-
 United Kingdom
-
United States
-
 Uruguay
-
 Uzbekistan
-
 Venezuela
-
 Vietnam
-
 Yemen
Yemen
-
 Zambia
-
 Zimbabwe
- Forex
- Crypto
