
APT consolidates near $0.98 as support at $0.885 holds for now: weekly report

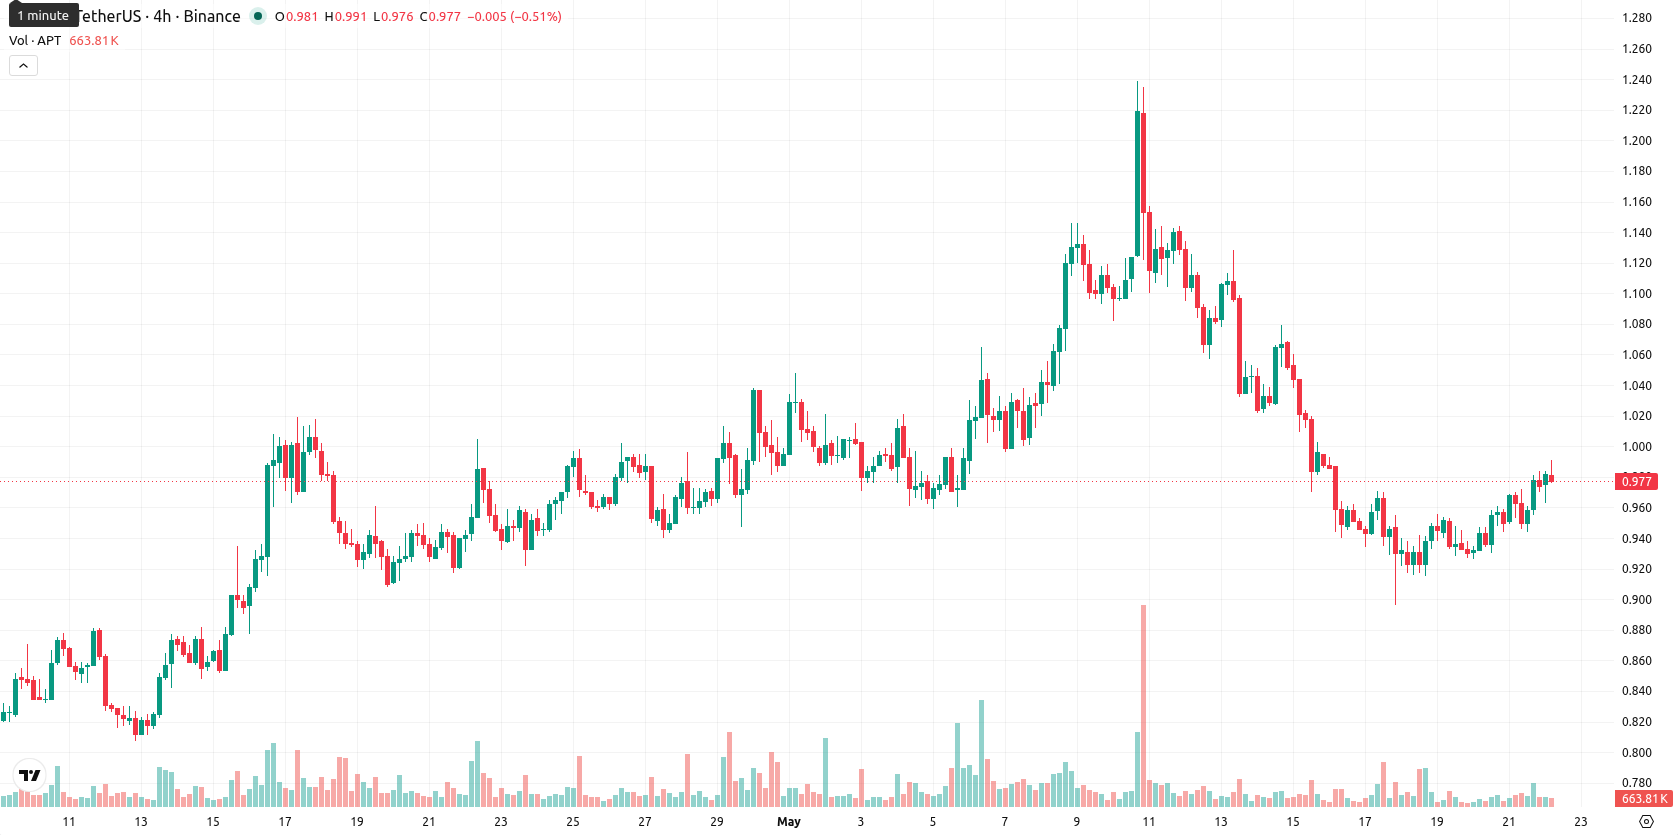
Aptos (APT) trades at $0.981, reflecting a weekly decline of $0.033 or 3.35%. The asset remains below its weekly MA-20 at $1.0651 and MA-50 at $2.6615, signaling continued seller momentum, with the MA-20 acting as near-term resistance.
Highlights
- APT remains under bearish pressure, trading below key moving averages and failing to show rebound momentum.
- Momentum indicators uniformly signal seller dominance, with no Buy signals across major technical metrics and a strong downside bias.
- Expected weekly range is $0.885 to $1.078, with risk skewed toward further downside unless resistance above $1.08 is breached.
Bearish technicals intensify as Aptos closes near resistance
On the weekly chart, Aptos continues to face downside pressure, trading just below the MA-20 and well beneath the MA-50. Dynamic resistance is set by the MA-20 at $1.0651, while the Ichimoku Kijun at $1.5900 is distant and not influential at current levels. Key weekly support is identified near $0.885 with resistance at $1.078. Momentum indicators confirm a bearish backdrop: MACD signals Strong Sell, ADX highlights persistent downside strength, RSI stands at 35.7 (Sell), while Stochastic RSI and CCI are neutral, and the Bull/Bear Power and Awesome Oscillator provide no signs of reversal. Recent volatility was 10.83%, with price ending the week near the upper end of the range but lacking bullish follow-through.
Sideways-to-lower bias expected as bearish signals dominate outlook
Looking ahead to the next 7 days, Aptos is likely to trade within a sideways-to-lower corridor between $0.885 and $1.078, consistent with ongoing consolidation and prevailing downside momentum identified on the weekly chart. A break above $1.08 would be required to shift sentiment, but this is improbable under current technical conditions. The probability of a sustained rally is very low (less than 20%), while an extended retest of support is favored by technical signals. The baseline scenario anticipates sideways-to-bearish movement as sellers remain in control.
Earlier, analysts noted that Aptos was under sustained bearish pressure with limited signs of momentum reversal. The current technical backdrop not only confirms this cautious outlook but also underscores the importance of observing the $1.08 resistance level for any potential shift in sentiment over the coming week.


-
 Afghanistan
-
 Albania
-
 Algeria
-
 Angola
-
 Argentina
-
 Armenia
-
 Australia
-
 Austria
-
 Azerbaijan
-
 Bahamas
-
 Bahrain
-
 Bangladesh
-
 Belarus
-
 Belgium
-
 Bolivia
-
 Botswana
-
 Brazil
-
 Brunei
-
 Bulgaria
-
 Cambodia
-
 Cameroon
-
 Canada
-
 Chile
Chile
-
 China
China
-
 Colombia
-
 Congo
Congo
-
 Costa Rica
-
 Cote d'Ivoire
-
 Croatia
-
 Cuba
Cuba
-
 Cyprus
-
 Czechia
-
 DR Congo
-
 Denmark
-
 Dominican Republic
-
 Ecuador
-
 Egypt
Egypt
-
 El Salvador
-
 Estonia
-
 Eswatini
-
 Ethiopia
-
 Finland
-
 France
-
 Georgia
-
 Germany
-
 Ghana
Ghana
-
 Greece
-
 Haiti
Haiti
-
 Hong Kong
-
 Hungary
-
 India
India
-
 Indonesia
-
 Iran, Islamic republic
-
 Iraq
Iraq
-
 Ireland
-
 Israel
-
 Italy
Italy
-
 Jamaica
-
 Japan
Japan
-
 Jordan
-
 Kazakhstan
-
 Kenya
Kenya
-
 Korea
Korea
-
 Kuwait
-
 Kyrgyzstan
-
 Laos
Laos
-
 Latvia
-
 Lebanon
-
 Lesotho
-
 Libya
Libya
-
 Lithuania
-
 Luxembourg
-
 Madagascar
-
 Malaysia
-
 Malta
Malta
-
 Mauritius
-
 Mexico
-
 Moldova
-
 Mongolia
-
 Montenegro
-
 Morocco
-
 Mozambique
-
 Myanmar
-
 Namibia
-
 Nepal
Nepal
-
 Netherlands
-
 New Zealand
-
 Nigeria
-
 North Macedonia
-
 Norway
-
 Oman
Oman
-
 Pakistan
-
 Palestine
-
 Panama
-
 Papua New Guinea
-
 Paraguay
-
 Peru
Peru
-
 Philippines
-
 Poland
-
 Portugal
-
 Puerto Rico
-
 Qatar
Qatar
-
 Reunion
-
 Romania
-
 Rwanda
-
 Saudi Arabia
-
 Serbia
-
 Singapore
-
 Slovakia
-
 Slovenia
-
 Somalia
-
 South Africa
-
 Spain
Spain
-
 Sri Lanka
-
 Sweden
-
 Switzerland
-
 Syria
Syria
-
 Taiwan
-
 Tajikistan
-
 Tanzania
-
 Thailand
-
 Trinidad and Tobago
-
 Tunisia
-
 Turkey
-
 UAE
UAE
-
 Uganda
-
 Ukraine
-
 United Kingdom
-
United States
-
 Uruguay
-
 Uzbekistan
-
 Venezuela
-
 Vietnam
-
 Yemen
Yemen
-
 Zambia
-
 Zimbabwe
- Forex
- Crypto
