
Curve price prediction: Support at $0.2210 in focus as CRV declines 7.81%

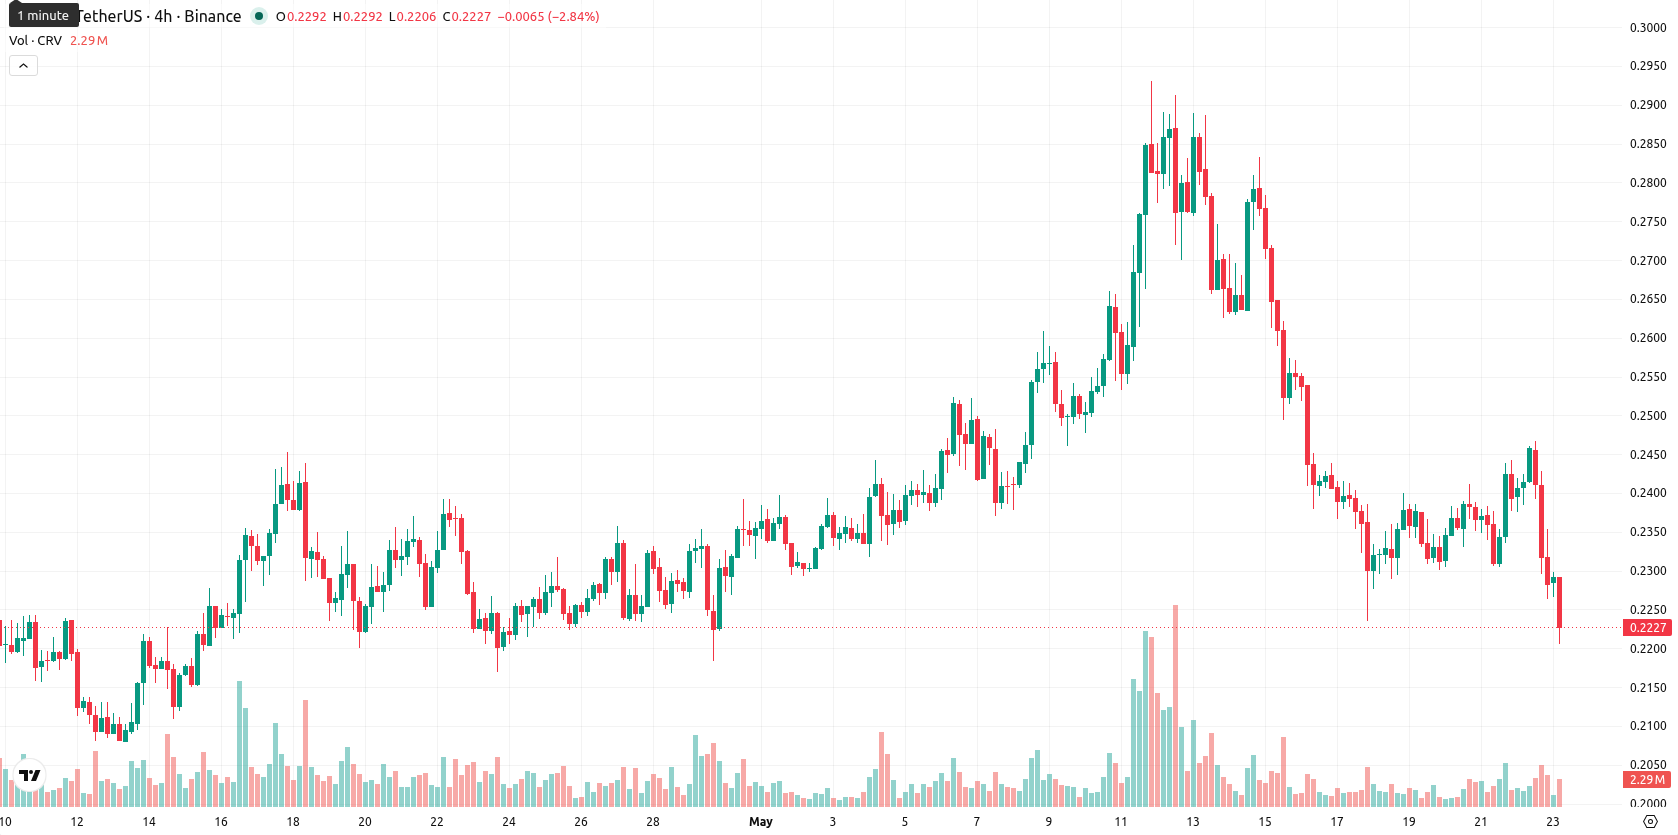
Curve (CRV) is trading at $0.2231, registering a daily decline of 7.81%. The asset remains below its key moving averages, reflecting persistent downside momentum.
Highlights
- CRV trades in a bearish structure across short, medium, and long-term timeframes, staying below key moving averages.
- Momentum and oscillators signal mild to deep oversold conditions, with weak buyer interest and seller dominance prevailing.
- For the next five days, price is expected to move sideways in a narrow $0.2210 to $0.2369 range, with further downside more likely.
Oversold signals and weak momentum cap intraday recovery
Technically, CRV is trading below the SMA-20 at $0.2485, SMA-50 at $0.2339, and SMA-200 at $0.3095. The Ichimoku Kijun level at $0.2558 serves as immediate overhead resistance. Support is established near $0.2210. RSI is at 44.5, CCI at -67.8, both pointing toward mild oversold conditions, while Stoch RSI is deep in oversold territory. MACD and ADX indicate subdued, negative momentum, with BBP slightly positive but suggesting weak buyer presence; overall, oscillators and momentum indicators confirm the prevailing intraday downside.
Sideways bias expected as bearish signals limit breakout risk
Over the next five trading days, price action is expected to remain within a volatility band of $0.2210 to $0.2369. Probability of a significant upward move is low, given that multi-timeframe signals from MA-50 (W1), RSI, ADX, and MACD remain bearish. The base case scenario is for continued sideways trading inside a narrow range. Breakout attempts above $0.2558 resistance could trigger a bullish scenario, while a move below immediate support at $0.2210 would expose further downside risk.
Previously it was reported that Curve faced persistent bearish momentum and limited potential for immediate recovery. Fresh confirmation from current price action and technicals suggests continued downside risk, making the $0.2210 support a critical level for traders to monitor in the coming sessions.


-
 Afghanistan
-
 Albania
-
 Algeria
-
 Angola
-
 Argentina
-
 Armenia
-
 Australia
-
 Austria
-
 Azerbaijan
-
 Bahamas
-
 Bahrain
-
 Bangladesh
-
 Belarus
-
 Belgium
-
 Bolivia
-
 Botswana
-
 Brazil
-
 Brunei
-
 Bulgaria
-
 Cambodia
-
 Cameroon
-
 Canada
-
 Chile
Chile
-
 China
China
-
 Colombia
-
 Congo
Congo
-
 Costa Rica
-
 Cote d'Ivoire
-
 Croatia
-
 Cuba
Cuba
-
 Cyprus
-
 Czechia
-
 DR Congo
-
 Denmark
-
 Dominican Republic
-
 Ecuador
-
 Egypt
Egypt
-
 El Salvador
-
 Estonia
-
 Eswatini
-
 Ethiopia
-
 Finland
-
 France
-
 Georgia
-
 Germany
-
 Ghana
Ghana
-
 Greece
-
 Haiti
Haiti
-
 Hong Kong
-
 Hungary
-
 India
India
-
 Indonesia
-
 Iran, Islamic republic
-
 Iraq
Iraq
-
 Ireland
-
 Israel
-
 Italy
Italy
-
 Jamaica
-
 Japan
Japan
-
 Jordan
-
 Kazakhstan
-
 Kenya
Kenya
-
 Korea
Korea
-
 Kuwait
-
 Kyrgyzstan
-
 Laos
Laos
-
 Latvia
-
 Lebanon
-
 Lesotho
-
 Libya
Libya
-
 Lithuania
-
 Luxembourg
-
 Madagascar
-
 Malaysia
-
 Malta
Malta
-
 Mauritius
-
 Mexico
-
 Moldova
-
 Mongolia
-
 Montenegro
-
 Morocco
-
 Mozambique
-
 Myanmar
-
 Namibia
-
 Nepal
Nepal
-
 Netherlands
-
 New Zealand
-
 Nigeria
-
 North Macedonia
-
 Norway
-
 Oman
Oman
-
 Pakistan
-
 Palestine
-
 Panama
-
 Papua New Guinea
-
 Paraguay
-
 Peru
Peru
-
 Philippines
-
 Poland
-
 Portugal
-
 Puerto Rico
-
 Qatar
Qatar
-
 Reunion
-
 Romania
-
 Rwanda
-
 Saudi Arabia
-
 Serbia
-
 Singapore
-
 Slovakia
-
 Slovenia
-
 Somalia
-
 South Africa
-
 Spain
Spain
-
 Sri Lanka
-
 Sweden
-
 Switzerland
-
 Syria
Syria
-
 Taiwan
-
 Tajikistan
-
 Tanzania
-
 Thailand
-
 Trinidad and Tobago
-
 Tunisia
-
 Turkey
-
 UAE
UAE
-
 Uganda
-
 Ukraine
-
 United Kingdom
-
United States
-
 Uruguay
-
 Uzbekistan
-
 Venezuela
-
 Vietnam
-
 Yemen
Yemen
-
 Zambia
-
 Zimbabwe
- Forex
- Crypto
