
Short-term selling dominates Arbitrum, pushing price lower

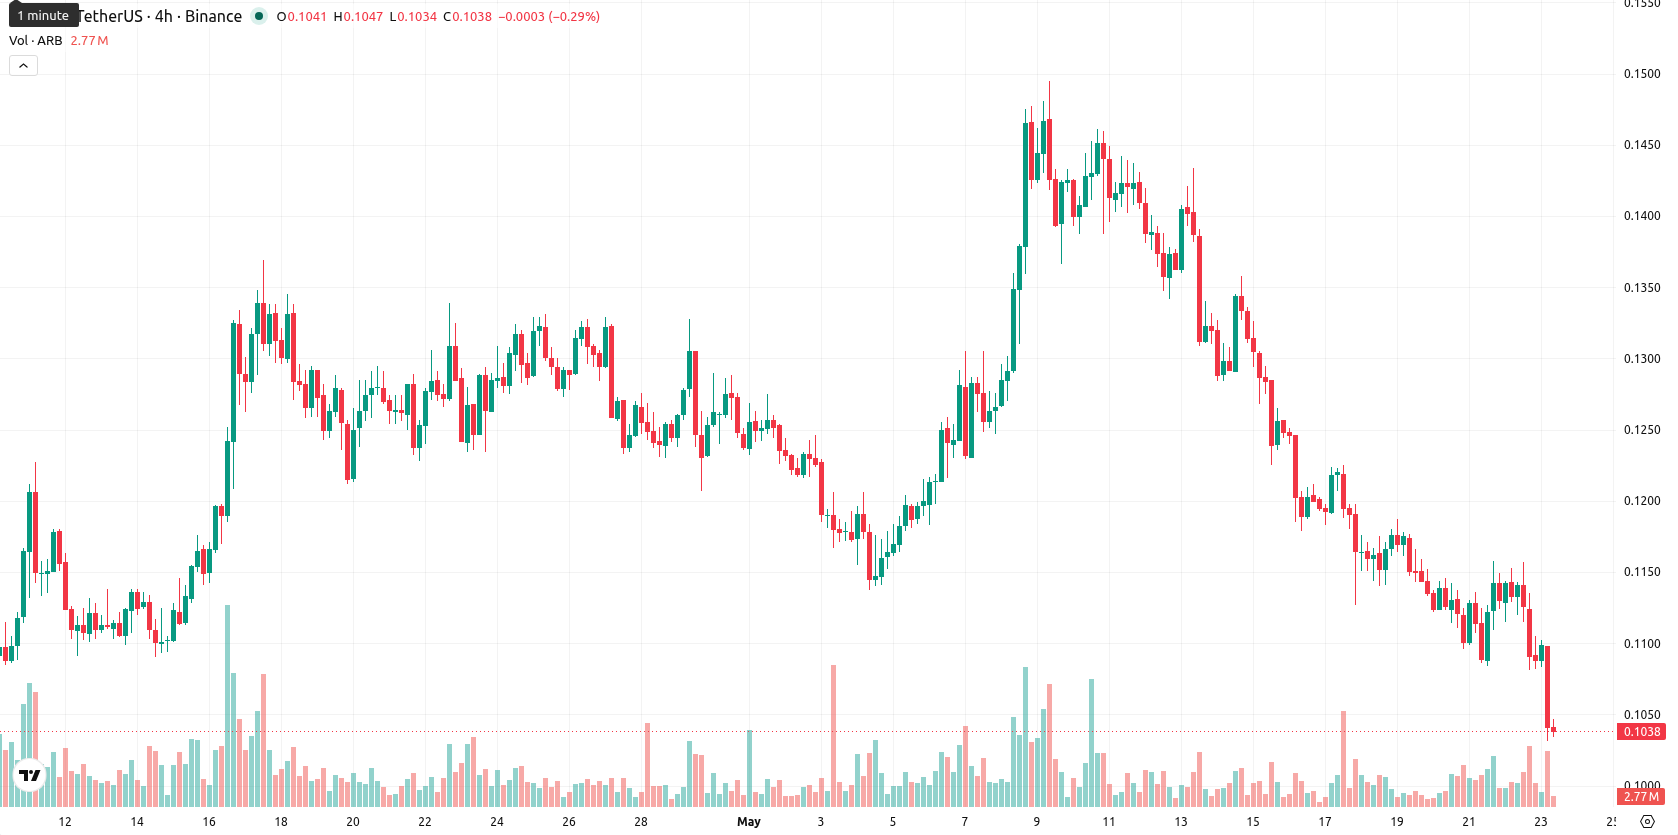
Arbitrum (ARB) is trading at $0.1042, down 8.03% on the session. The asset remains well below its key moving averages, suggesting persistent weakness relative to short- and long-term trend indicators.
Highlights
- ARB trades decisively below key moving averages, confirming persistent selling pressure across short-, medium-, and long-term horizons.
- Daily and weekly momentum indicators including MACD, ADX, and RSI reinforce a broadly bearish outlook with seller dominance.
- Expected trading range is $0.1000–$0.1150 this week, with a high probability of further downside unless $0.1290 resistance is reclaimed.
Seller momentum intensifies as indicators breach key technical levels
ARB is currently trading below the MA-20 at $0.1252, MA-50 at $0.1205, and MA-200 at $0.1554, with the Ichimoku Kijun level also higher at $0.1290 and acting as near-term resistance. Momentum indicators on the daily timeframe, including MACD and ADX, signal weak momentum and dominant seller control. Daily RSI at 36.82, along with oversold readings from Stoch RSI and CCI, underscore heavily sold conditions, while negative BBP highlights continued seller dominance. The Awesome Oscillator also points downward, and intraday volatility has seen the price move toward the bottom of its $0.1042–$0.11 range early in the session, with no material divergence from prevailing trends.
Further downside risk grows as indicators support bearish outlook
Over the coming week, ARB is likely to fluctuate within a $0.1000–$0.1150 volatility band reflecting its current pressure and typical market action. There is a high probability of further declines, given that all major weekly indicators (RSI, ADX, MACD, and MA-50) reinforce a continued selling scenario. The baseline case remains sideways to lower within this corridor. A bullish reversal would require a close above immediate resistance at $0.1290, while a break below $0.1000 could accelerate losses and deepen oversold momentum.
Earlier, analysts noted that Arbitrum continued to exhibit persistent bearish momentum underlined by technical pressures and downside risk. The latest market action reinforces this negative outlook, with renewed selling and oversold signals increasing the likelihood of further declines and making the $0.1000 mark an essential level for traders to monitor in the days ahead.


-
 Afghanistan
-
 Albania
-
 Algeria
-
 Angola
-
 Argentina
-
 Armenia
-
 Australia
-
 Austria
-
 Azerbaijan
-
 Bahamas
-
 Bahrain
-
 Bangladesh
-
 Belarus
-
 Belgium
-
 Bolivia
-
 Botswana
-
 Brazil
-
 Brunei
-
 Bulgaria
-
 Cambodia
-
 Cameroon
-
 Canada
-
 Chile
Chile
-
 China
China
-
 Colombia
-
 Congo
Congo
-
 Costa Rica
-
 Cote d'Ivoire
-
 Croatia
-
 Cuba
Cuba
-
 Cyprus
-
 Czechia
-
 DR Congo
-
 Denmark
-
 Dominican Republic
-
 Ecuador
-
 Egypt
Egypt
-
 El Salvador
-
 Estonia
-
 Eswatini
-
 Ethiopia
-
 Finland
-
 France
-
 Georgia
-
 Germany
-
 Ghana
Ghana
-
 Greece
-
 Haiti
Haiti
-
 Hong Kong
-
 Hungary
-
 India
India
-
 Indonesia
-
 Iran, Islamic republic
-
 Iraq
Iraq
-
 Ireland
-
 Israel
-
 Italy
Italy
-
 Jamaica
-
 Japan
Japan
-
 Jordan
-
 Kazakhstan
-
 Kenya
Kenya
-
 Korea
Korea
-
 Kuwait
-
 Kyrgyzstan
-
 Laos
Laos
-
 Latvia
-
 Lebanon
-
 Lesotho
-
 Libya
Libya
-
 Lithuania
-
 Luxembourg
-
 Madagascar
-
 Malaysia
-
 Malta
Malta
-
 Mauritius
-
 Mexico
-
 Moldova
-
 Mongolia
-
 Montenegro
-
 Morocco
-
 Mozambique
-
 Myanmar
-
 Namibia
-
 Nepal
Nepal
-
 Netherlands
-
 New Zealand
-
 Nigeria
-
 North Macedonia
-
 Norway
-
 Oman
Oman
-
 Pakistan
-
 Palestine
-
 Panama
-
 Papua New Guinea
-
 Paraguay
-
 Peru
Peru
-
 Philippines
-
 Poland
-
 Portugal
-
 Puerto Rico
-
 Qatar
Qatar
-
 Reunion
-
 Romania
-
 Rwanda
-
 Saudi Arabia
-
 Serbia
-
 Singapore
-
 Slovakia
-
 Slovenia
-
 Somalia
-
 South Africa
-
 Spain
Spain
-
 Sri Lanka
-
 Sweden
-
 Switzerland
-
 Syria
Syria
-
 Taiwan
-
 Tajikistan
-
 Tanzania
-
 Thailand
-
 Trinidad and Tobago
-
 Tunisia
-
 Turkey
-
 UAE
UAE
-
 Uganda
-
 Ukraine
-
 United Kingdom
-
United States
-
 Uruguay
-
 Uzbekistan
-
 Venezuela
-
 Vietnam
-
 Yemen
Yemen
-
 Zambia
-
 Zimbabwe
- Forex
- Crypto
