
-7.16% for Immutable X as immediate resistance stalls any rebound

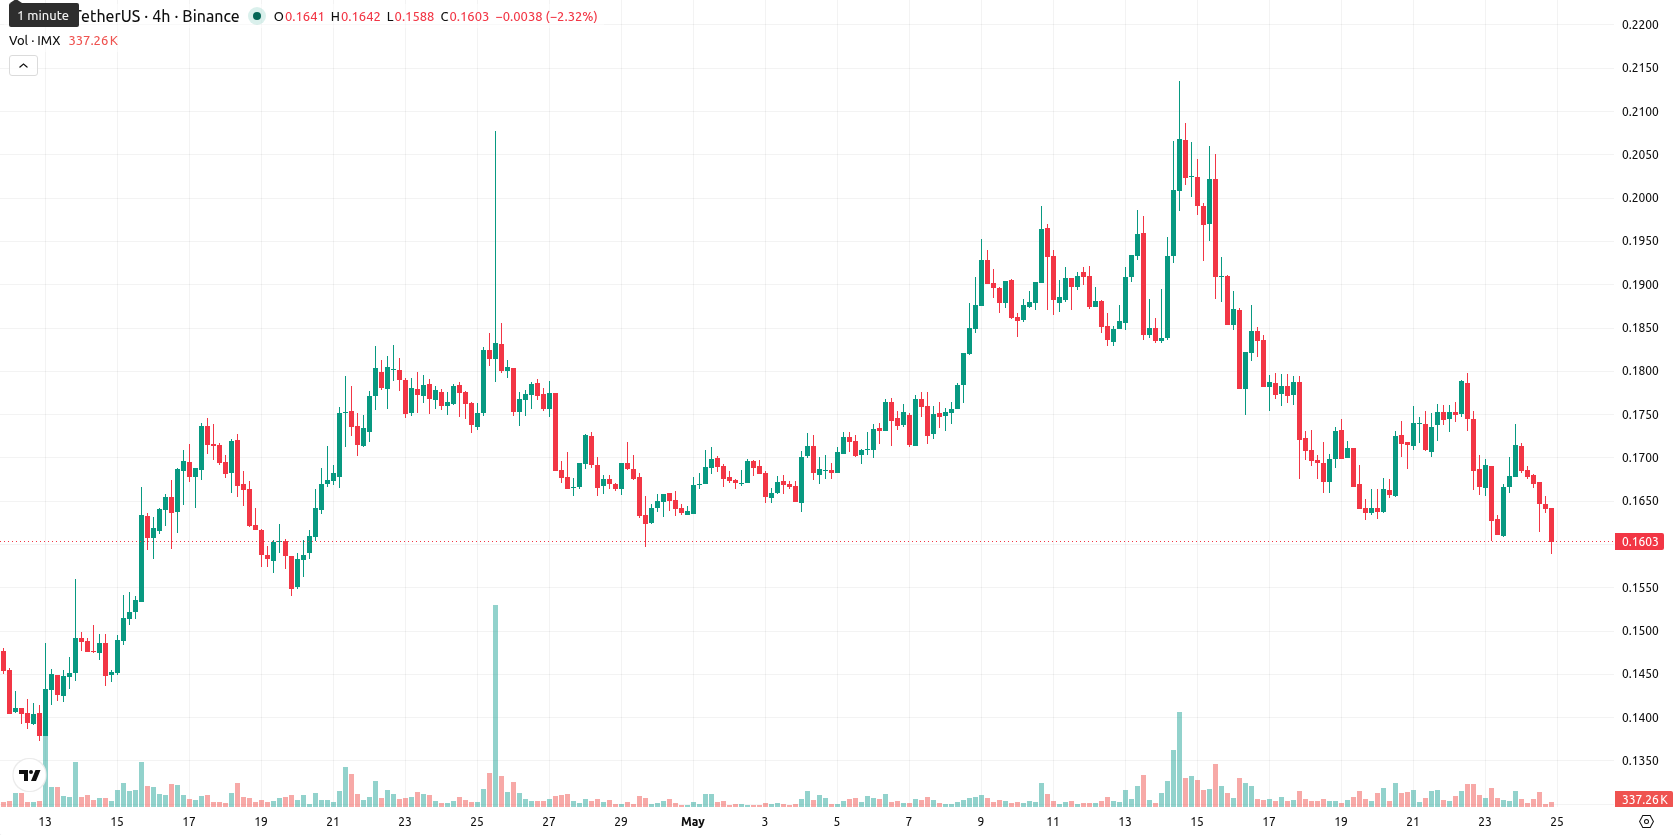
Immutable X (IMX) is trading at $0.1595, marking a daily decline of 7.16%. The price is positioned below its key moving averages, signaling a continuation of recent selling momentum.
Highlights
- IMX trades below key short-, medium-, and long-term moving averages, confirming persistent downside pressure from sellers.
- Technical indicators show prevailing bearish momentum, with some oversold oscillators suggesting possible short-term stabilization.
- Expected trading range for the coming week is $0.145–$0.175, with probability of further decline remaining high.
Resistance across moving averages as momentum readings diverge
IMX is trading below the SMA-20 ($0.1788), SMA-50 ($0.1669), and SMA-200 ($0.2193) levels, indicating short-, medium-, and long-term moving average resistance. The nearest Ichimoku Kijun level is at $0.1866, which acts as immediate technical resistance, while there is little visible support in the present zone. Momentum indicators present a mixed picture: the ADX at 30.56 on the daily timeframe points to pronounced trend strength with a 'Buy' bias, though the MACD reads as neutral. RSI stands at 48.09 and CCI at -79.08, both reflecting a slightly bearish bias, whereas the Stoch RSI at 19.26 signals oversold conditions that could indicate selling exhaustion. Negative BBP and a downward-pointing Awesome Oscillator confirm dominant seller activity intraday, and the price sits near session lows inside a high volatility band.
Sideways price range expected amid stalled downtrend
For the short term, IMX is expected to trade in a $0.145–$0.175 range, reflecting typical volatility around current levels. The baseline scenario is for the price to move sideways within this band as the downtrend pauses. If IMX breaks above $0.175, upside targets shift to the $0.186–$0.190 zone, whereas a sustained drop below $0.145 would expose the asset to additional downside risk amid weak technical support.
Earlier, analysts noted that Immutable X was locked in a persistent downtrend fueled by sustained selling pressure and limited upside potential. The latest technical signals reinforce this bearish narrative, and traders should focus on the $0.145 support level as a decisive threshold for further downside risk.


-
 Afghanistan
-
 Albania
-
 Algeria
-
 Angola
-
 Argentina
-
 Armenia
-
 Australia
-
 Austria
-
 Azerbaijan
-
 Bahamas
-
 Bahrain
-
 Bangladesh
-
 Belarus
-
 Belgium
-
 Bolivia
-
 Botswana
-
 Brazil
-
 Brunei
-
 Bulgaria
-
 Cambodia
-
 Cameroon
-
 Canada
-
 Chile
Chile
-
 China
China
-
 Colombia
-
 Congo
Congo
-
 Costa Rica
-
 Cote d'Ivoire
-
 Croatia
-
 Cuba
Cuba
-
 Cyprus
-
 Czechia
-
 DR Congo
-
 Denmark
-
 Dominican Republic
-
 Ecuador
-
 Egypt
Egypt
-
 El Salvador
-
 Estonia
-
 Eswatini
-
 Ethiopia
-
 Finland
-
 France
-
 Georgia
-
 Germany
-
 Ghana
Ghana
-
 Greece
-
 Haiti
Haiti
-
 Hong Kong
-
 Hungary
-
 India
India
-
 Indonesia
-
 Iran, Islamic republic
-
 Iraq
Iraq
-
 Ireland
-
 Israel
-
 Italy
Italy
-
 Jamaica
-
 Japan
Japan
-
 Jordan
-
 Kazakhstan
-
 Kenya
Kenya
-
 Korea
Korea
-
 Kuwait
-
 Kyrgyzstan
-
 Laos
Laos
-
 Latvia
-
 Lebanon
-
 Lesotho
-
 Libya
Libya
-
 Lithuania
-
 Luxembourg
-
 Madagascar
-
 Malaysia
-
 Malta
Malta
-
 Mauritius
-
 Mexico
-
 Moldova
-
 Mongolia
-
 Montenegro
-
 Morocco
-
 Mozambique
-
 Myanmar
-
 Namibia
-
 Nepal
Nepal
-
 Netherlands
-
 New Zealand
-
 Nigeria
-
 North Macedonia
-
 Norway
-
 Oman
Oman
-
 Pakistan
-
 Palestine
-
 Panama
-
 Papua New Guinea
-
 Paraguay
-
 Peru
Peru
-
 Philippines
-
 Poland
-
 Portugal
-
 Puerto Rico
-
 Qatar
Qatar
-
 Reunion
-
 Romania
-
 Rwanda
-
 Saudi Arabia
-
 Serbia
-
 Singapore
-
 Slovakia
-
 Slovenia
-
 Somalia
-
 South Africa
-
 Spain
Spain
-
 Sri Lanka
-
 Sweden
-
 Switzerland
-
 Syria
Syria
-
 Taiwan
-
 Tajikistan
-
 Tanzania
-
 Thailand
-
 Trinidad and Tobago
-
 Tunisia
-
 Turkey
-
 UAE
UAE
-
 Uganda
-
 Ukraine
-
 United Kingdom
-
United States
-
 Uruguay
-
 Uzbekistan
-
 Venezuela
-
 Vietnam
-
 Yemen
Yemen
-
 Zambia
-
 Zimbabwe
- Forex
- Crypto
