
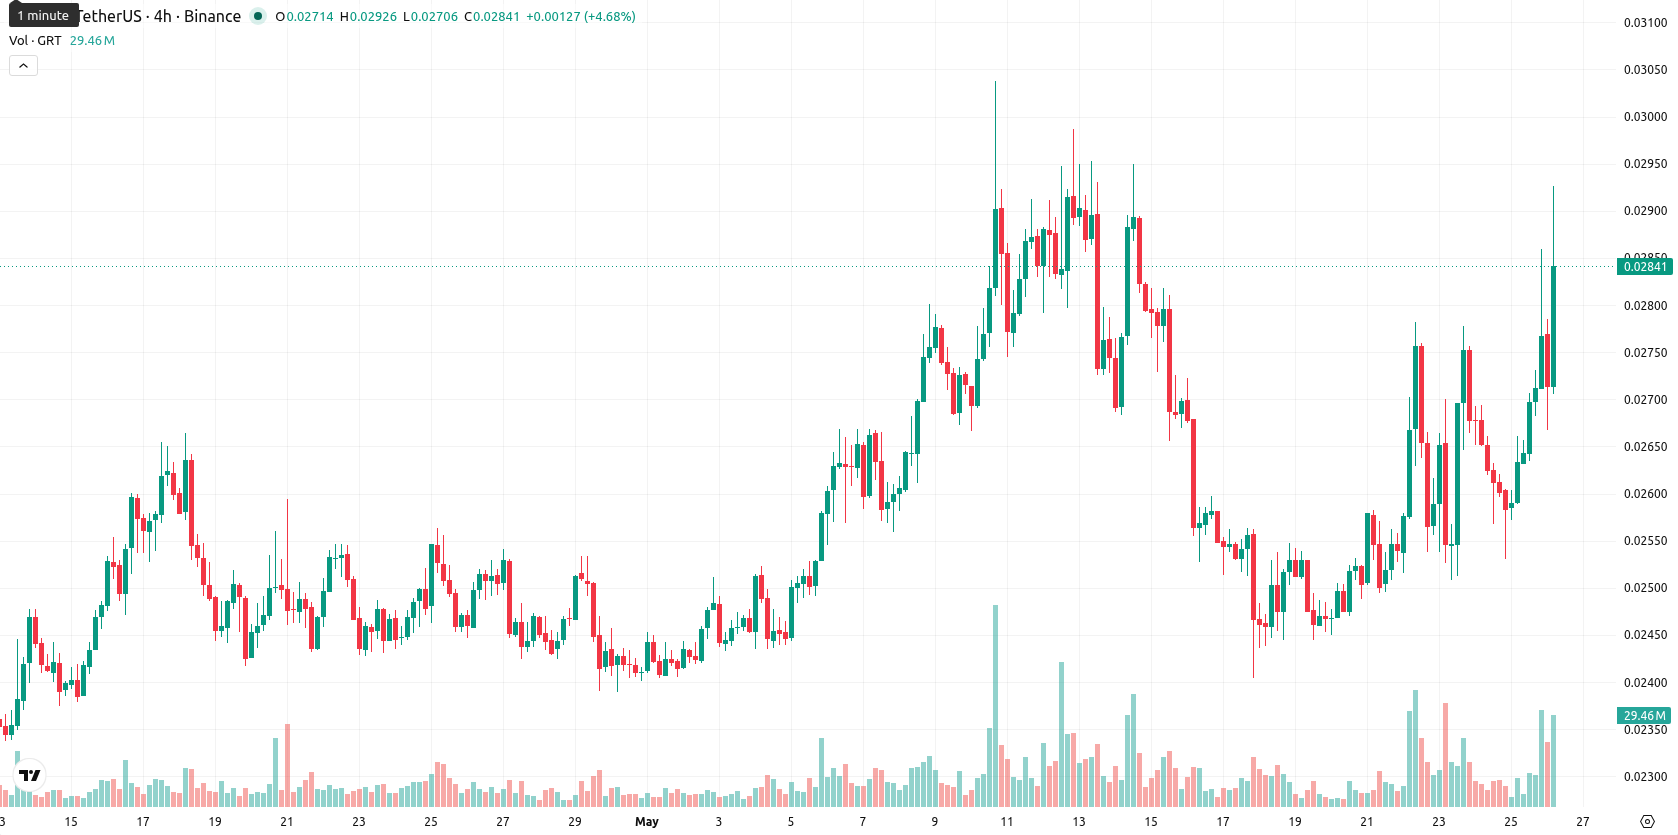
The Graph extends gains as price holds above key moving averages

The Graph (GRT) is trading at $0.028325 after a strong session, advancing by 7.21% on the day. The price currently sits above its short- and medium-term moving averages, reflecting constructive short-term momentum.
Highlights
- Short- and medium-term bullish momentum prevails as GRT price holds above key moving averages, despite long-term resistance from sellers.
- Momentum indicators confirm buyer strength, while volatility remains elevated and session price action stays near daily highs.
- GRT is expected to fluctuate between $0.02740 and $0.02920 over the next five days, with a greater probability of decline unless $0.02920 resistance is breached.
Buyer control confirmed as technical indicators align above support
On the technical front, GRT is positioned above the MA-20 at $0.026611 and MA-50 at $0.025418, while remaining below the MA-200 at $0.033828. The Ichimoku Kijun sits at $0.027135, providing immediate support, and the current support and resistance levels are marked at $0.02710 and $0.02920, respectively. Daily momentum signals, including MACD and ADX, confirm persistent buyer strength, with the RSI reading at 58 and Stoch RSI elevated but not overbought. The CCI remains neutral, while BBP highlights strong buyer dominance during the session; the Awesome Oscillator does not contradict the prevailing bullish tone.
Consolidation expected as breakout risk remains contained
Over the next five trading days, GRT is expected to fluctuate within a typical volatility band of $0.02740 to $0.02920. The probability of a further break higher is low—estimated below 20%—with the base scenario favoring ongoing consolidation within this range. A move above $0.02920 could trigger additional gains on a breakout, while a push below immediate support at $0.02710 may accelerate declines and test lower price levels. Resistance in the weekly and long-term technical indicators is likely to constrain any immediate upside extension.
Earlier, analysts noted that The Graph was exhibiting a shift toward short-term bullish momentum but faced ongoing volatility and the risk of rapid reversals. The most recent price action further validates this scenario, with persistent buyer strength supporting a consolidation phase, yet a decisive move beyond $0.02920 could serve as the next major catalyst for directional change.


Latest GRT News


-
 Afghanistan
-
 Albania
-
 Algeria
-
 Angola
-
 Argentina
-
 Armenia
-
 Australia
-
 Austria
-
 Azerbaijan
-
 Bahamas
-
 Bahrain
-
 Bangladesh
-
 Belarus
-
 Belgium
-
 Bolivia
-
 Botswana
-
 Brazil
-
 Brunei
-
 Bulgaria
-
 Cambodia
-
 Cameroon
-
 Canada
-
 Chile
Chile
-
 China
China
-
 Colombia
-
 Congo
Congo
-
 Costa Rica
-
 Cote d'Ivoire
-
 Croatia
-
 Cuba
Cuba
-
 Cyprus
-
 Czechia
-
 DR Congo
-
 Denmark
-
 Dominican Republic
-
 Ecuador
-
 Egypt
Egypt
-
 El Salvador
-
 Estonia
-
 Eswatini
-
 Ethiopia
-
 Finland
-
 France
-
 Georgia
-
 Germany
-
 Ghana
Ghana
-
 Greece
-
 Haiti
Haiti
-
 Hong Kong
-
 Hungary
-
 India
India
-
 Indonesia
-
 Iran, Islamic republic
-
 Iraq
Iraq
-
 Ireland
-
 Israel
-
 Italy
Italy
-
 Jamaica
-
 Japan
Japan
-
 Jordan
-
 Kazakhstan
-
 Kenya
Kenya
-
 Korea
Korea
-
 Kuwait
-
 Kyrgyzstan
-
 Laos
Laos
-
 Latvia
-
 Lebanon
-
 Lesotho
-
 Libya
Libya
-
 Lithuania
-
 Luxembourg
-
 Madagascar
-
 Malaysia
-
 Malta
Malta
-
 Mauritius
-
 Mexico
-
 Moldova
-
 Mongolia
-
 Montenegro
-
 Morocco
-
 Mozambique
-
 Myanmar
-
 Namibia
-
 Nepal
Nepal
-
 Netherlands
-
 New Zealand
-
 Nigeria
-
 North Macedonia
-
 Norway
-
 Oman
Oman
-
 Pakistan
-
 Palestine
-
 Panama
-
 Papua New Guinea
-
 Paraguay
-
 Peru
Peru
-
 Philippines
-
 Poland
-
 Portugal
-
 Puerto Rico
-
 Qatar
Qatar
-
 Reunion
-
 Romania
-
 Rwanda
-
 Saudi Arabia
-
 Serbia
-
 Singapore
-
 Slovakia
-
 Slovenia
-
 Somalia
-
 South Africa
-
 Spain
Spain
-
 Sri Lanka
-
 Sweden
-
 Switzerland
-
 Syria
Syria
-
 Taiwan
-
 Tajikistan
-
 Tanzania
-
 Thailand
-
 Trinidad and Tobago
-
 Tunisia
-
 Turkey
-
 UAE
UAE
-
 Uganda
-
 Ukraine
-
 United Kingdom
-
United States
-
 Uruguay
-
 Uzbekistan
-
 Venezuela
-
 Vietnam
-
 Yemen
Yemen
-
 Zambia
-
 Zimbabwe
- Forex
- Crypto
