
Polkadot declines as supply cut and ETF debut fail to stem downward pressure: weekly review

Polkadot (DOT) is trading at $1.116, down $0.13 or 10.43% over the past week. The asset remains firmly below its weekly MA-20 at $1.337, the MA-50 at $2.471, and the MA-200 at $5.007, signaling persistent bearish momentum and medium- to long-term downward pressure.
 0.827
0.874
0.827
0.874
Highlights
- Polkadot (DOT) remains in a sustained downtrend, trading below major moving averages and facing persistent bearish momentum.
- Technical indicators signal strong selling pressure, with momentum oscillators oversold and no bullish divergences or reversal signs present.
- DOT is likely to consolidate between $1.05 and $1.27 in the coming week; a drop below $1.05 could lead to new lows.
Structural shifts emerge as token supply cut and ETF debut shape sentiment
Polkadot has implemented a substantial token issuance reduction, lowering its supply by 53%. The launch of the first US exchange-traded fund directly linked to DOT by 21Shares on Nasdaq under the TDOT ticker brought in roughly $11 million and offers institutional investors a regulated entry to DOT. These developments mark structural changes that could impact market dynamics and investor interest.
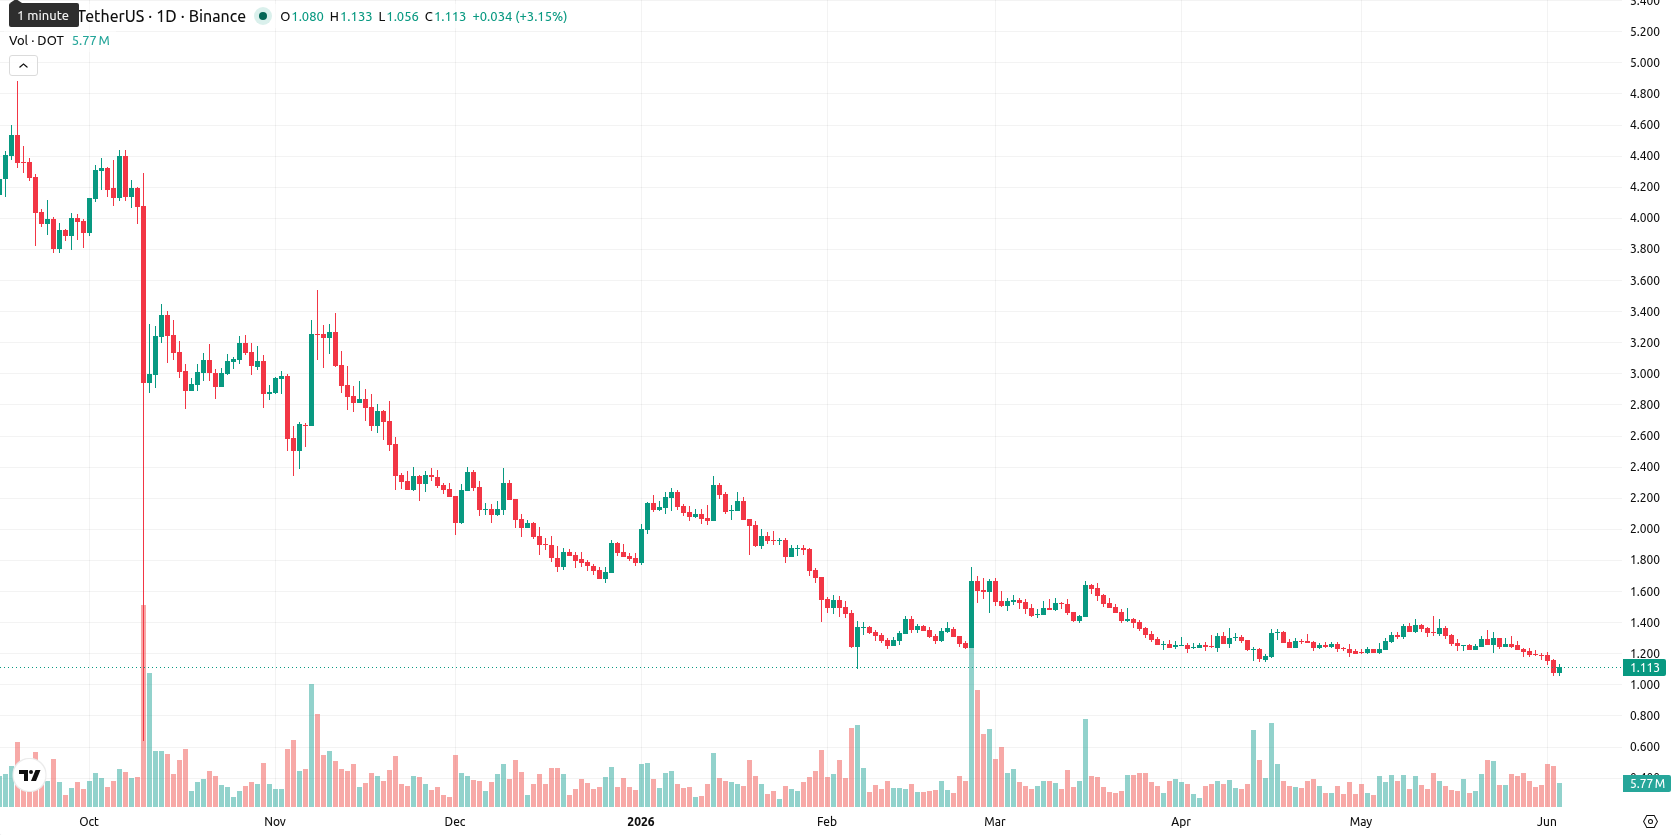
Sustained downside confirmed as major moving averages act as resistance
Weekly technical analysis confirms Polkadot's strong downward trend, with price action consistently below all major moving averages (MA-20, MA-50, and MA-200), which now act as dynamic resistance. Momentum remains negative, as indicated by a Sell signal from the MACD and a robust ADX. The RSI, Commodity Channel Index, and Stochastic RSI are all positioned in or near oversold territory, underscoring pronounced bearish sentiment and potential for short-term exhaustion. Bull/Bear Power remains negative, and weekly volatility is elevated at 17.16%, with the price lingering near the lower end of the weekly range.
Further losses possible in coming week as bearish signals persist
For the next 7 days, DOT is expected to trade within a $1.05 to $1.27 corridor, consistent with recent volatility and continued negative momentum on weekly indicators. The probability of a price increase is low, with none of the four key indicators suggesting a Buy signal. DOT could stabilize and consolidate if selling pressure abates, but a break above $1.27 may target $1.33 as resistance — this scenario appears unlikely given current momentum. A move below $1.05 could trigger further declines and expose DOT to renewed selling pressure, potentially pushing it toward its yearly lows.
Earlier, analysts noted that Polkadot was entrenched in a bearish trend amid sustained technical weakness and persistent selling momentum. The current analysis reinforces and expands on this outlook, highlighting that institutional developments and structural supply changes have yet to shift sentiment, with downside risk remaining elevated should DOT breach the $1.05 level in the coming week.


Latest Polkadot News






-
 Afghanistan
-
 Albania
-
 Algeria
-
 Angola
-
 Argentina
-
 Armenia
-
 Australia
-
 Austria
-
 Azerbaijan
-
 Bahamas
-
 Bahrain
-
 Bangladesh
-
 Belarus
-
 Belgium
-
 Bolivia
-
 Botswana
-
 Brazil
-
 Brunei
-
 Bulgaria
-
 Cambodia
-
 Cameroon
-
 Canada
-
 Chile
Chile
-
 China
China
-
 Colombia
-
 Congo
Congo
-
 Costa Rica
-
 Cote d'Ivoire
-
 Croatia
-
 Cuba
Cuba
-
 Cyprus
-
 Czechia
-
 DR Congo
-
 Denmark
-
 Dominican Republic
-
 Ecuador
-
 Egypt
Egypt
-
 El Salvador
-
 Estonia
-
 Eswatini
-
 Ethiopia
-
 Finland
-
 France
-
 Georgia
-
 Germany
-
 Ghana
Ghana
-
 Greece
-
 Haiti
Haiti
-
 Hong Kong
-
 Hungary
-
 India
India
-
 Indonesia
-
 Iran, Islamic republic
-
 Iraq
Iraq
-
 Ireland
-
 Israel
-
 Italy
Italy
-
 Jamaica
-
 Japan
Japan
-
 Jordan
-
 Kazakhstan
-
 Kenya
Kenya
-
 Korea
Korea
-
 Kuwait
-
 Kyrgyzstan
-
 Laos
Laos
-
 Latvia
-
 Lebanon
-
 Lesotho
-
 Libya
Libya
-
 Lithuania
-
 Luxembourg
-
 Madagascar
-
 Malaysia
-
 Malta
Malta
-
 Mauritius
-
 Mexico
-
 Moldova
-
 Mongolia
-
 Montenegro
-
 Morocco
-
 Mozambique
-
 Myanmar
-
 Namibia
-
 Nepal
Nepal
-
 Netherlands
-
 New Zealand
-
 Nigeria
-
 North Macedonia
-
 Norway
-
 Oman
Oman
-
 Pakistan
-
 Palestine
-
 Panama
-
 Papua New Guinea
-
 Paraguay
-
 Peru
Peru
-
 Philippines
-
 Poland
-
 Portugal
-
 Puerto Rico
-
 Qatar
Qatar
-
 Reunion
-
 Romania
-
 Rwanda
-
 Saudi Arabia
-
 Serbia
-
 Singapore
-
 Slovakia
-
 Slovenia
-
 Somalia
-
 South Africa
-
 Spain
Spain
-
 Sri Lanka
-
 Sweden
-
 Switzerland
-
 Syria
Syria
-
 Taiwan
-
 Tajikistan
-
 Tanzania
-
 Thailand
-
 Trinidad and Tobago
-
 Tunisia
-
 Turkey
-
 UAE
UAE
-
 Uganda
-
 Ukraine
-
 United Kingdom
-
United States
-
 Uruguay
-
 Uzbekistan
-
 Venezuela
-
 Vietnam
-
 Yemen
Yemen
-
 Zambia
-
 Zimbabwe
- Forex
- Crypto











