
XLM declines as current volatility remains elevated at 50.61%: weekly report

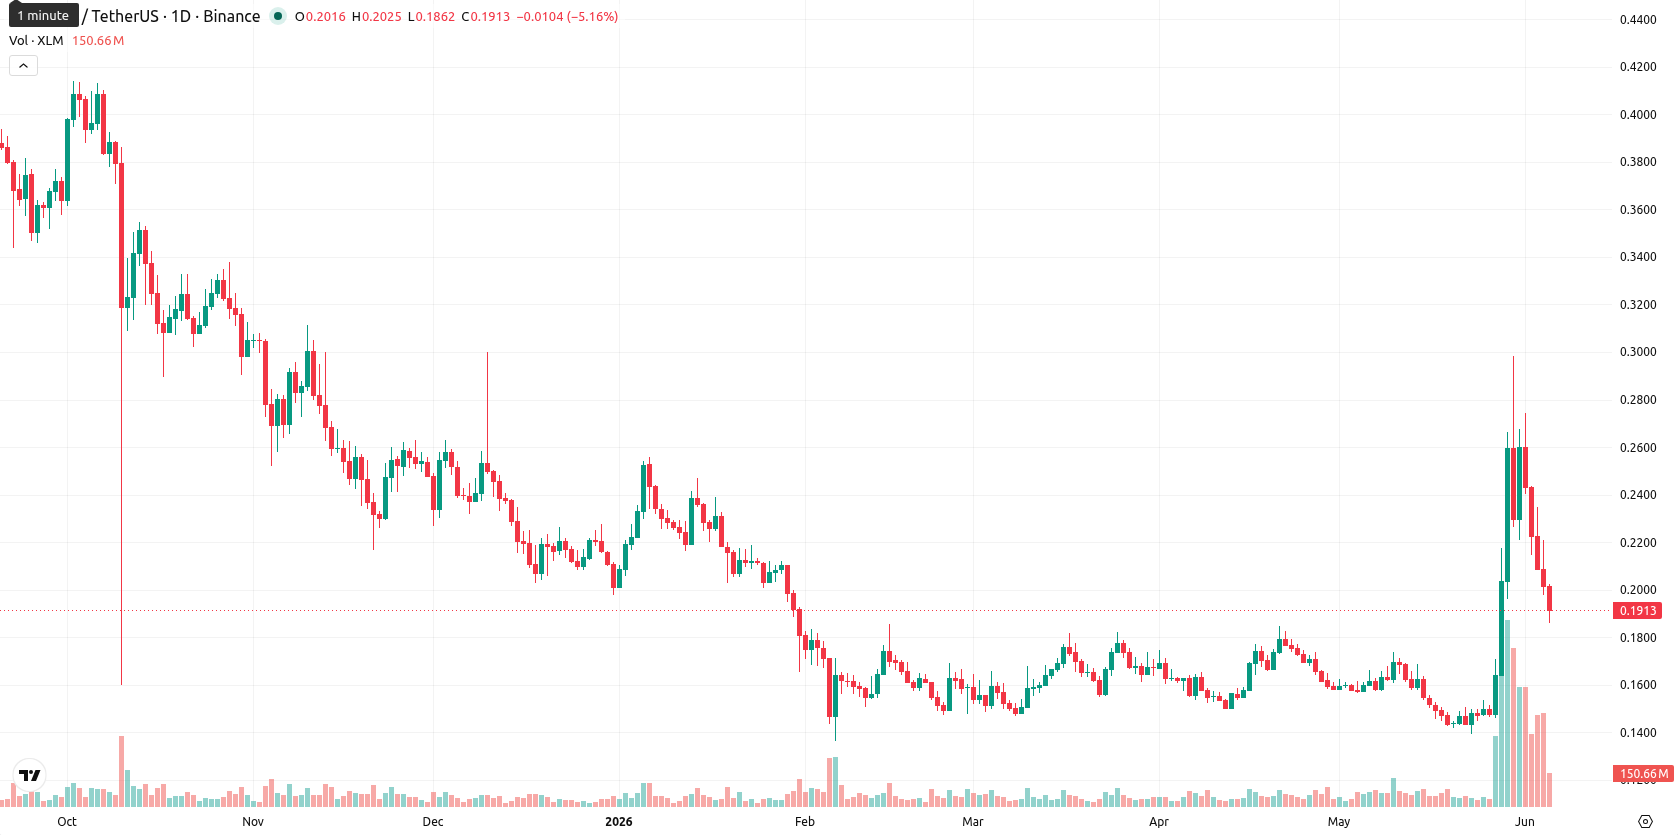
Stellar (XLM) is currently trading at $0.1916, having declined $0.0167 (7.44%) over the past week. The asset sits above its weekly MA-20 ($0.1697), just above MA-200 ($0.1809), but remains below the MA-50 ($0.2619), indicating that while medium-term momentum has improved, longer-term resistance persists with MA-50 as the nearest weekly ceiling.
Highlights
- XLM trades above key weekly support but remains below longer-term resistance, signaling unresolved directional momentum.
- Technical indicators are mixed, with short-term bullish signals countered by ongoing bearish bias and overbought conditions.
- XLM is expected to consolidate within a $0.1730–$0.2100 range over the next week amid heightened volatility.
Sentiment weakens this week on fading DTCC hype and cross-border token pressure
Stellar's recent period saw fading retail demand after earlier excitement surrounding its partnership with the Depository Trust & Clearing Corporation (DTCC) for asset tokenization. On June 4, XLM experienced $2.71 million in long position liquidations out of $3.19 million total, underscoring heightened volatility. Weak investor sentiment and sector-wide pressure on cross-border remittance tokens have also taken a toll.
Technical signals mixed as elevated volatility sustains persistent selling pressure
On the weekly chart, XLM has retreated to the bottom of its recent range, with volatility elevated at 50.61%. The asset trades above the MA-20 and MA-200, but below the MA-50, confirming ongoing resistance from the longer-term trend. Weekly momentum signals are mixed: the MACD shows a strong bearish bias, while the ADX points to a modest bullish trend; RSI is neutral-to-bullish, but the Stochastic RSI indicates strong selling momentum and CCI flags overbought conditions. Bull/Bear Power still points to short-term buyer dominance, but overall the picture reflects persistent selling pressure through the end of the week.
Sideways range favored in coming week as technical indicators lack consensus
For the next seven days, XLM is expected to range between $0.1730 and $0.2100. Weekly indicators do not provide a clear directional bias, with roughly even odds of price increase or decrease, as only half the technical signals favor buying. The central scenario is for continued sideways action near current prices. Upside attempts above $0.2100 are possible if buyers regain strength, while further weakness could trigger a test of support near $0.1730.
Earlier, analysts noted that Stellar remained under broader selling pressure despite ecosystem expansion and new partnerships supporting its long-term potential. The latest technical and sentiment data reinforce this cautionary stance, with traders advised to watch for sustained moves above $0.2100 or breakdowns below $0.1730 as signals for the next directional shift.


-
 Afghanistan
-
 Albania
-
 Algeria
-
 Angola
-
 Argentina
-
 Armenia
-
 Australia
-
 Austria
-
 Azerbaijan
-
 Bahamas
-
 Bahrain
-
 Bangladesh
-
 Belarus
-
 Belgium
-
 Bolivia
-
 Botswana
-
 Brazil
-
 Brunei
-
 Bulgaria
-
 Cambodia
-
 Cameroon
-
 Canada
-
 Chile
Chile
-
 China
China
-
 Colombia
-
 Congo
Congo
-
 Costa Rica
-
 Cote d'Ivoire
-
 Croatia
-
 Cuba
Cuba
-
 Cyprus
-
 Czechia
-
 DR Congo
-
 Denmark
-
 Dominican Republic
-
 Ecuador
-
 Egypt
Egypt
-
 El Salvador
-
 Estonia
-
 Eswatini
-
 Ethiopia
-
 Finland
-
 France
-
 Georgia
-
 Germany
-
 Ghana
Ghana
-
 Greece
-
 Haiti
Haiti
-
 Hong Kong
-
 Hungary
-
 India
India
-
 Indonesia
-
 Iran, Islamic republic
-
 Iraq
Iraq
-
 Ireland
-
 Israel
-
 Italy
Italy
-
 Jamaica
-
 Japan
Japan
-
 Jordan
-
 Kazakhstan
-
 Kenya
Kenya
-
 Korea
Korea
-
 Kuwait
-
 Kyrgyzstan
-
 Laos
Laos
-
 Latvia
-
 Lebanon
-
 Lesotho
-
 Libya
Libya
-
 Lithuania
-
 Luxembourg
-
 Madagascar
-
 Malaysia
-
 Malta
Malta
-
 Mauritius
-
 Mexico
-
 Moldova
-
 Mongolia
-
 Montenegro
-
 Morocco
-
 Mozambique
-
 Myanmar
-
 Namibia
-
 Nepal
Nepal
-
 Netherlands
-
 New Zealand
-
 Nigeria
-
 North Macedonia
-
 Norway
-
 Oman
Oman
-
 Pakistan
-
 Palestine
-
 Panama
-
 Papua New Guinea
-
 Paraguay
-
 Peru
Peru
-
 Philippines
-
 Poland
-
 Portugal
-
 Puerto Rico
-
 Qatar
Qatar
-
 Reunion
-
 Romania
-
 Rwanda
-
 Saudi Arabia
-
 Serbia
-
 Singapore
-
 Slovakia
-
 Slovenia
-
 Somalia
-
 South Africa
-
 Spain
Spain
-
 Sri Lanka
-
 Sweden
-
 Switzerland
-
 Syria
Syria
-
 Taiwan
-
 Tajikistan
-
 Tanzania
-
 Thailand
-
 Trinidad and Tobago
-
 Tunisia
-
 Turkey
-
 UAE
UAE
-
 Uganda
-
 Ukraine
-
 United Kingdom
-
United States
-
 Uruguay
-
 Uzbekistan
-
 Venezuela
-
 Vietnam
-
 Yemen
Yemen
-
 Zambia
-
 Zimbabwe
- Forex
- Crypto
