
Stellar price prediction: Will $0.1718–$0.2913 range provide support as XLM falls 8.01%?

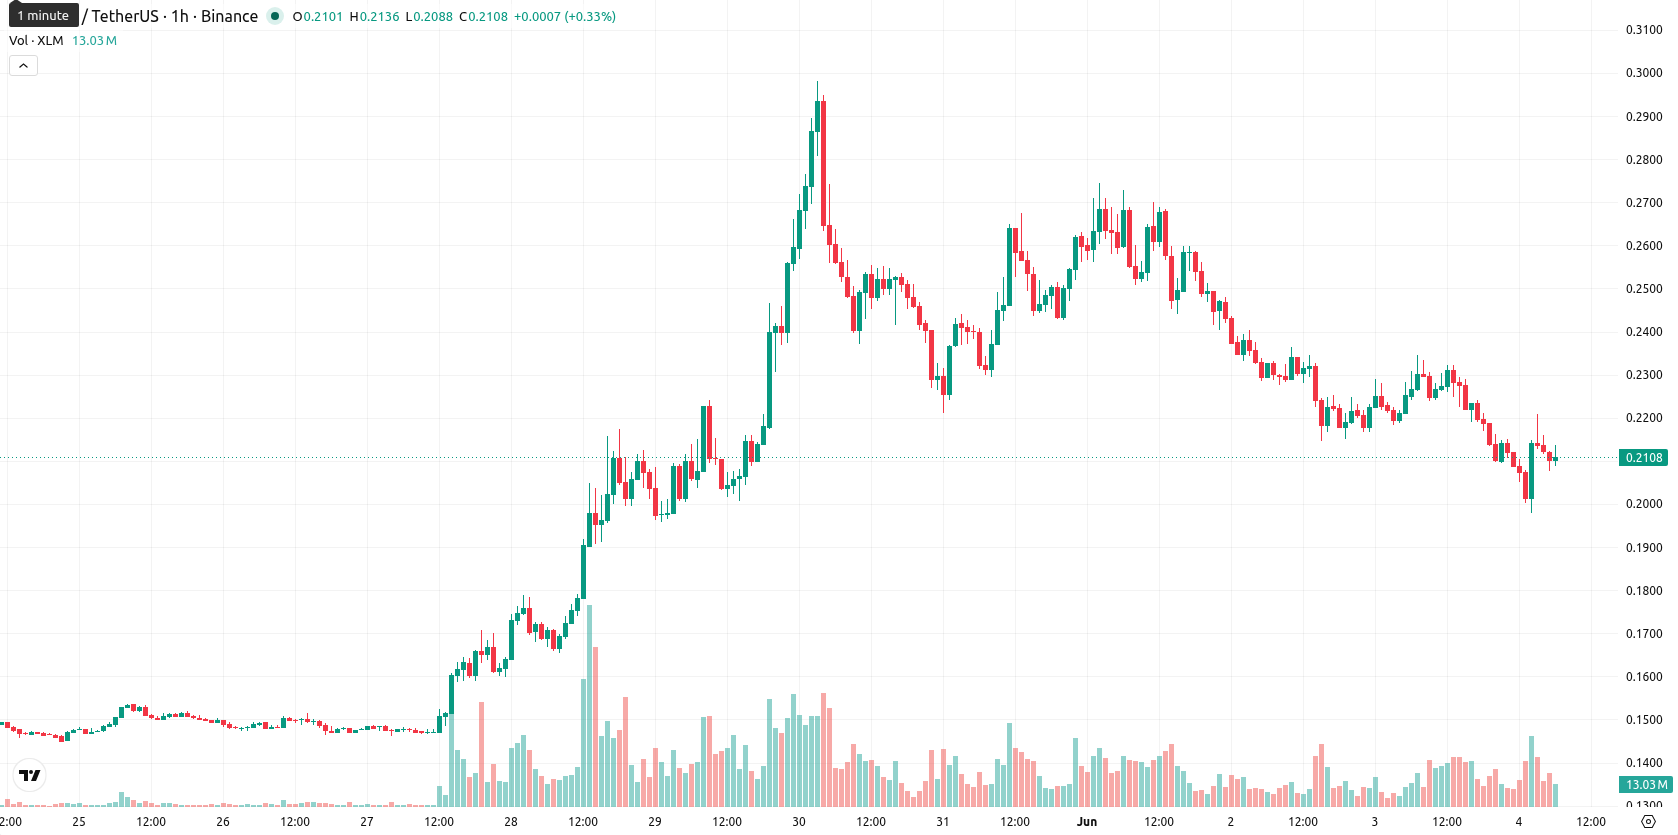
Stellar (XLM) is trading at $0.2114, down 8.01% for the day in a session marked by strong volatility. The price currently sits below its key short- and medium-term moving averages but remains above the long-term average, reflecting a complex technical landscape.
Highlights
- Stellar's collaboration with DTCC to tokenize new asset classes expands blockchain adoption and real-world utility for the network.
- MoneyGram introduced the MGUSD stablecoin for U.S. users on Stellar, further strengthening the protocol's ecosystem despite ongoing selling pressure.
- XLM/USD faces persistent bearish momentum, trading below short-term averages with a high probability of consolidating between $0.1718 and $0.2913 over the next few days.
Ecosystem expansion accelerates despite persistent selling pressure
Stellar has moved forward with a partnership involving the Depository Trust & Clearing Corporation to tokenize assets, adding new asset classes to its blockchain and broadening real-world application scenarios. This development may drive enhanced transactional activity on the Stellar network, although recent events have not immediately reversed selling momentum. Additionally, MoneyGram's launch of the MGUSD stablecoin for U.S. users on Stellar marked another step in expanding the protocol's ecosystem, though price action has remained under broader selling pressure.
Bearish momentum dominates as mixed signals reveal resistance
On the hourly timeframe, XLM/USD is trading below the MA-20 at $0.2171 and the MA-50 at $0.2222, while holding above the MA-200 on the daily chart at $0.1897. The Ichimoku Kijun is located at $0.2166, acting as immediate resistance. Momentum indicators show MACD signaling a strong sell, ADX neutral, RSI at 41.949 indicating a sell, and CCI also pointing to a sell. Stoch RSI is overbought, while BBP confirms sellers dominate intraday. The Awesome Oscillator remains neutral, and overall, indicator signals are mixed with some signs of exhaustion but a prevailing bearish sentiment.
Range-bound movement likely as resistance limits short-term upside
Across the next 2–3 trading days, XLM/USD is likely to consolidate within a range of $0.1718 to $0.2913, reflecting typical volatility relative to current levels. The baseline view calls for range-bound movement, with a low probability assigned to a sustained up move. Upside risk would require a breakout above immediate resistance around $0.2166, while a breakdown through support could accelerate losses toward the lower end of the forecast corridor.
Previously it was reported that MoneyGram launched its MGUSD stablecoin for U.S. users on the Stellar blockchain, signaling enhanced integration of digital dollars within the network. With ongoing asset tokenization initiatives and technical consolidation underway, traders should monitor for a breakout above immediate resistance or a breakdown through support as potential signals for a directional move beyond the current range.


-
 Afghanistan
-
 Albania
-
 Algeria
-
 Angola
-
 Argentina
-
 Armenia
-
 Australia
-
 Austria
-
 Azerbaijan
-
 Bahamas
-
 Bahrain
-
 Bangladesh
-
 Belarus
-
 Belgium
-
 Bolivia
-
 Botswana
-
 Brazil
-
 Brunei
-
 Bulgaria
-
 Cambodia
-
 Cameroon
-
 Canada
-
 Chile
Chile
-
 China
China
-
 Colombia
-
 Congo
Congo
-
 Costa Rica
-
 Cote d'Ivoire
-
 Croatia
-
 Cuba
Cuba
-
 Cyprus
-
 Czechia
-
 DR Congo
-
 Denmark
-
 Dominican Republic
-
 Ecuador
-
 Egypt
Egypt
-
 El Salvador
-
 Estonia
-
 Eswatini
-
 Ethiopia
-
 Finland
-
 France
-
 Georgia
-
 Germany
-
 Ghana
Ghana
-
 Greece
-
 Haiti
Haiti
-
 Hong Kong
-
 Hungary
-
 India
India
-
 Indonesia
-
 Iran, Islamic republic
-
 Iraq
Iraq
-
 Ireland
-
 Israel
-
 Italy
Italy
-
 Jamaica
-
 Japan
Japan
-
 Jordan
-
 Kazakhstan
-
 Kenya
Kenya
-
 Korea
Korea
-
 Kuwait
-
 Kyrgyzstan
-
 Laos
Laos
-
 Latvia
-
 Lebanon
-
 Lesotho
-
 Libya
Libya
-
 Lithuania
-
 Luxembourg
-
 Madagascar
-
 Malaysia
-
 Malta
Malta
-
 Mauritius
-
 Mexico
-
 Moldova
-
 Mongolia
-
 Montenegro
-
 Morocco
-
 Mozambique
-
 Myanmar
-
 Namibia
-
 Nepal
Nepal
-
 Netherlands
-
 New Zealand
-
 Nigeria
-
 North Macedonia
-
 Norway
-
 Oman
Oman
-
 Pakistan
-
 Palestine
-
 Panama
-
 Papua New Guinea
-
 Paraguay
-
 Peru
Peru
-
 Philippines
-
 Poland
-
 Portugal
-
 Puerto Rico
-
 Qatar
Qatar
-
 Reunion
-
 Romania
-
 Rwanda
-
 Saudi Arabia
-
 Serbia
-
 Singapore
-
 Slovakia
-
 Slovenia
-
 Somalia
-
 South Africa
-
 Spain
Spain
-
 Sri Lanka
-
 Sweden
-
 Switzerland
-
 Syria
Syria
-
 Taiwan
-
 Tajikistan
-
 Tanzania
-
 Thailand
-
 Trinidad and Tobago
-
 Tunisia
-
 Turkey
-
 UAE
UAE
-
 Uganda
-
 Ukraine
-
 United Kingdom
-
United States
-
 Uruguay
-
 Uzbekistan
-
 Venezuela
-
 Vietnam
-
 Yemen
Yemen
-
 Zambia
-
 Zimbabwe
- Forex
- Crypto
