

-7.74% for Tezos as downward action tests $0.23947854–$0.2847 range

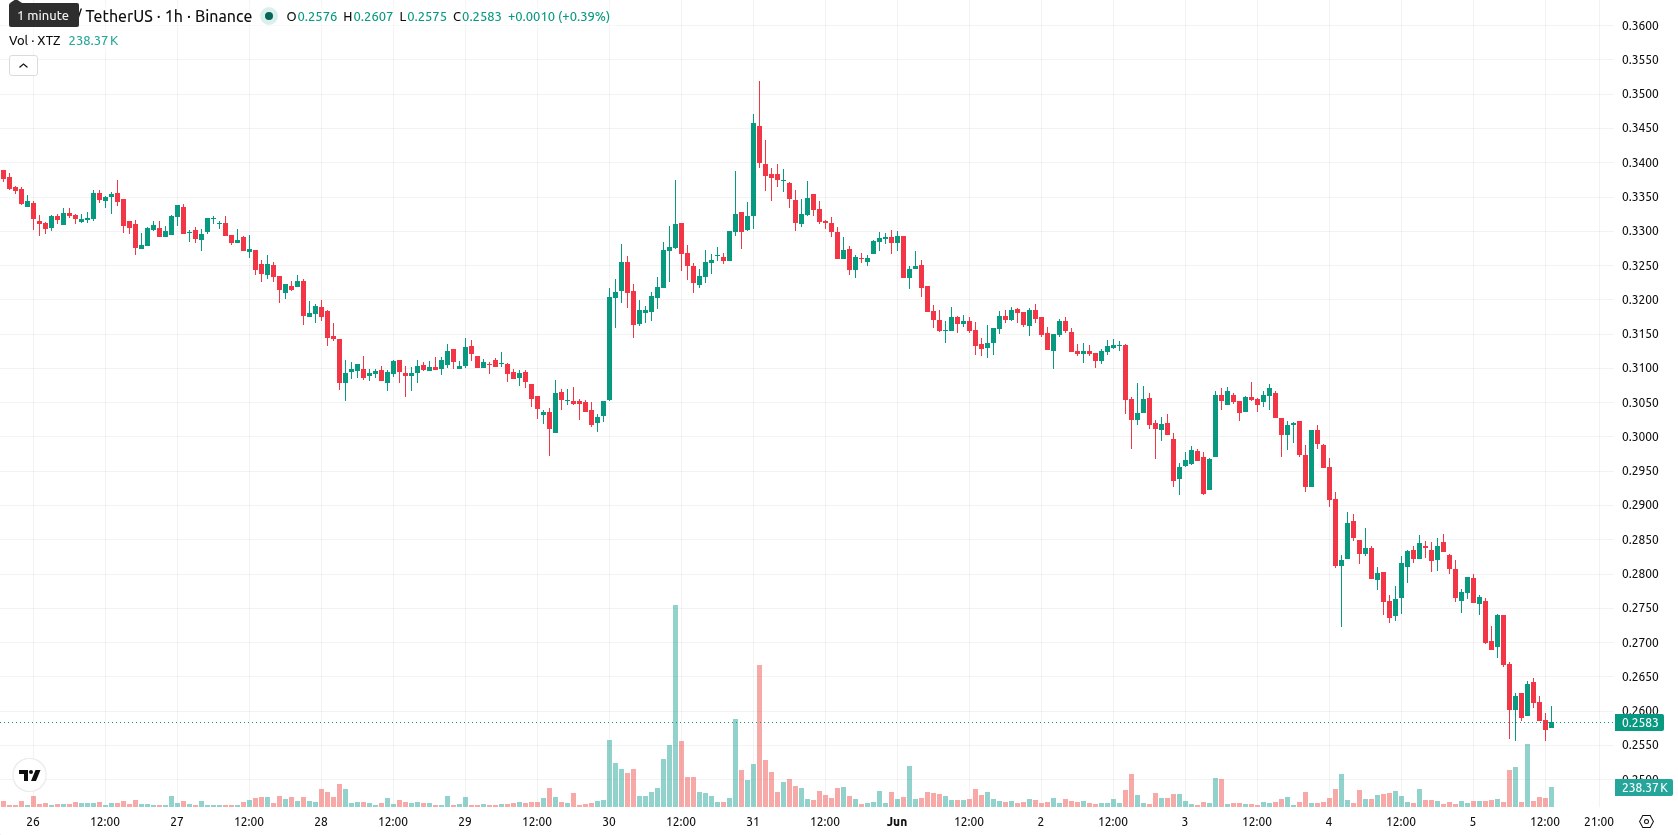
Tezos (XTZ) is trading at $0.2573 after a daily decline of 7.74%, with the price remaining below its key moving averages for this timeframe.
 0.3247
0.35210000
0.3247
0.35210000
Highlights
- XTZ/USD remains in a pronounced downtrend, trading below all key moving averages and signaling continued bearish momentum.
- Momentum and oscillator indicators confirm strong seller dominance, with price action near session lows and volatility elevated.
- Anticipated trading range is $0.23947854 to $0.28470000, with downside breakout risk high unless resistance near $0.26885000 is reclaimed.
Downward momentum deepens as multiple bearish signals align
On the technical front, XTZ/USD is trading below the MA-20 ($0.27025500) and MA-50 ($0.28230400) on the H1 chart, as well as well beneath the long-term MA-200 ($0.42690350) on the daily timeframe. The Ichimoku Kijun at $0.26885000 now acts as immediate resistance, capping any upside attempts. Intraday momentum indicators—MACD, ADX, and BBP—are all decisively negative, pointing to strong selling dominance, while the RSI sits at 32.94, highlighting oversold conditions echoed by the Stoch RSI and CCI.
Downside risk persists as breakout unlikely in current range
In the short term, XTZ/USD is expected to trade within a range between $0.23947854 and $0.28470000, reflecting a typical volatility band relative to current levels. The probability of a move higher is assessed as very low, with a much higher likelihood of further downside. Consolidation within the stated range is the baseline, while a decisive break below support could accelerate losses. Conversely, a bullish scenario would require a confirmed breakout above the immediate resistance near the Kijun.
Earlier, analysts noted that Tezos was facing persistent bearish pressure amid ongoing technical weakness. The continuation of negative momentum and oversold conditions now increases the risk of a significant downside break, making the $0.23947854 level a critical support to monitor for potential further declines.





Latest Tezos News






-
 Afghanistan
-
 Albania
-
 Algeria
-
 Angola
-
 Argentina
-
 Armenia
-
 Australia
-
 Austria
-
 Azerbaijan
-
 Bahamas
-
 Bahrain
-
 Bangladesh
-
 Belarus
-
 Belgium
-
 Bolivia
-
 Botswana
-
 Brazil
-
 Brunei
-
 Bulgaria
-
 Cambodia
-
 Cameroon
-
 Canada
-
 Chile
Chile
-
 China
China
-
 Colombia
-
 Congo
Congo
-
 Costa Rica
-
 Cote d'Ivoire
-
 Croatia
-
 Cuba
Cuba
-
 Cyprus
-
 Czechia
-
 DR Congo
-
 Denmark
-
 Dominican Republic
-
 Ecuador
-
 Egypt
Egypt
-
 El Salvador
-
 Estonia
-
 Eswatini
-
 Ethiopia
-
 Finland
-
 France
-
 Georgia
-
 Germany
-
 Ghana
Ghana
-
 Greece
-
 Haiti
Haiti
-
 Hong Kong
-
 Hungary
-
 India
India
-
 Indonesia
-
 Iran, Islamic republic
-
 Iraq
Iraq
-
 Ireland
-
 Israel
-
 Italy
Italy
-
 Jamaica
-
 Japan
Japan
-
 Jordan
-
 Kazakhstan
-
 Kenya
Kenya
-
 Korea
Korea
-
 Kuwait
-
 Kyrgyzstan
-
 Laos
Laos
-
 Latvia
-
 Lebanon
-
 Lesotho
-
 Libya
Libya
-
 Lithuania
-
 Luxembourg
-
 Madagascar
-
 Malaysia
-
 Malta
Malta
-
 Mauritius
-
 Mexico
-
 Moldova
-
 Mongolia
-
 Montenegro
-
 Morocco
-
 Mozambique
-
 Myanmar
-
 Namibia
-
 Nepal
Nepal
-
 Netherlands
-
 New Zealand
-
 Nigeria
-
 North Macedonia
-
 Norway
-
 Oman
Oman
-
 Pakistan
-
 Palestine
-
 Panama
-
 Papua New Guinea
-
 Paraguay
-
 Peru
Peru
-
 Philippines
-
 Poland
-
 Portugal
-
 Puerto Rico
-
 Qatar
Qatar
-
 Reunion
-
 Romania
-
 Rwanda
-
 Saudi Arabia
-
 Serbia
-
 Singapore
-
 Slovakia
-
 Slovenia
-
 Somalia
-
 South Africa
-
 Spain
Spain
-
 Sri Lanka
-
 Sweden
-
 Switzerland
-
 Syria
Syria
-
 Taiwan
-
 Tajikistan
-
 Tanzania
-
 Thailand
-
 Trinidad and Tobago
-
 Tunisia
-
 Turkey
-
 UAE
UAE
-
 Uganda
-
 Ukraine
-
 United Kingdom
-
United States
-
 Uruguay
-
 Uzbekistan
-
 Venezuela
-
 Vietnam
-
 Yemen
Yemen
-
 Zambia
-
 Zimbabwe
- Forex
- Crypto












