
Sui slips as price struggles below $0.9748 MA-20 resistance: weekly outlook

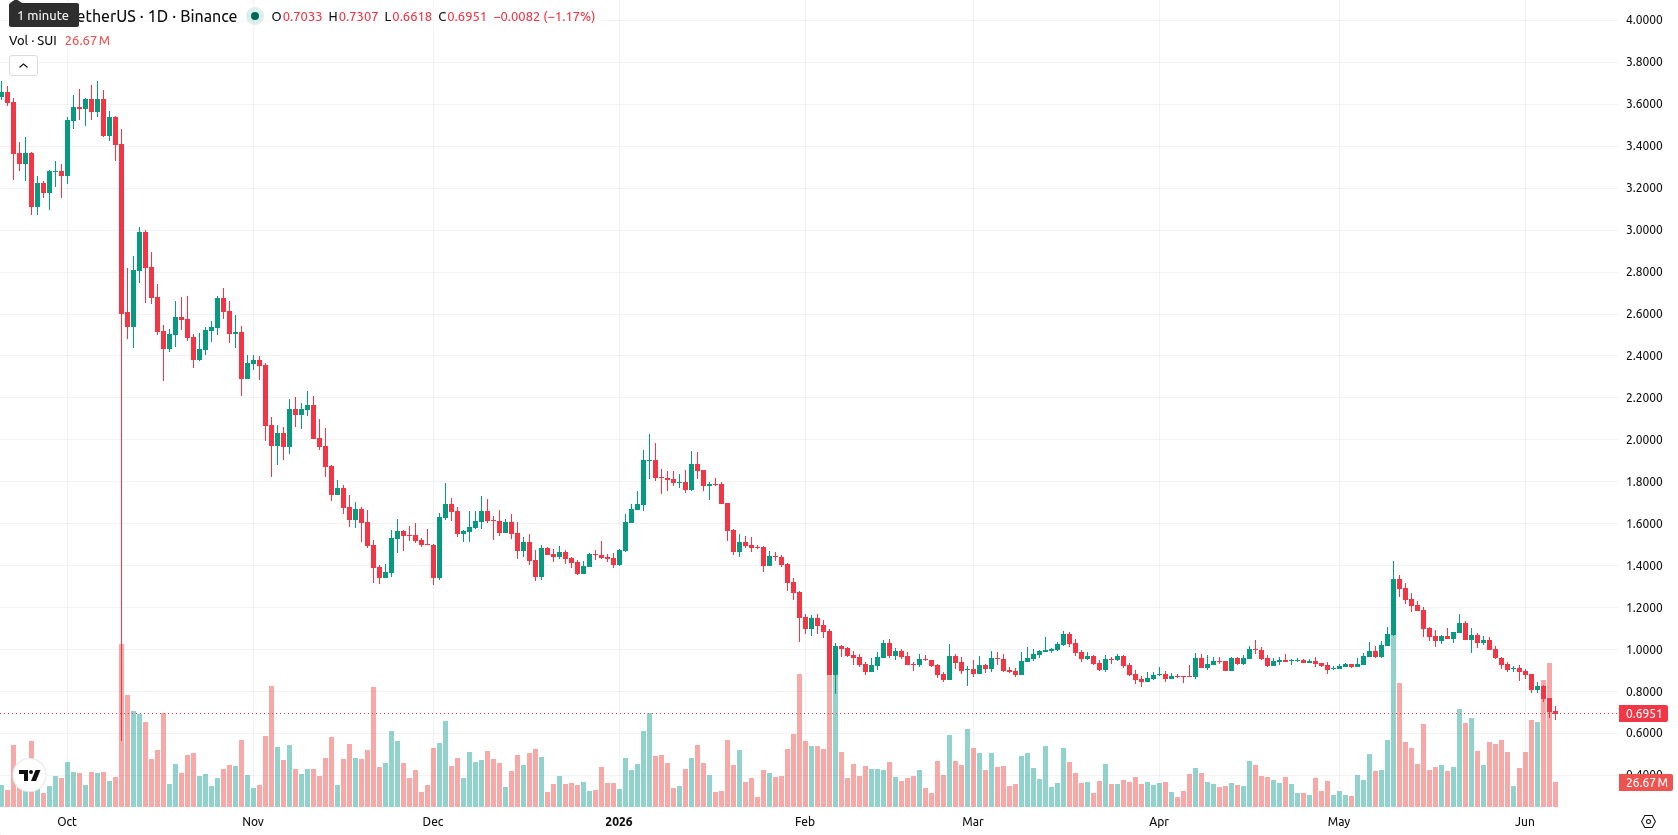
Sui (SUI) is currently trading at $0.6908, down $0.2119 or 23.47% over the past week. The asset remains well below its weekly MA-20 at $0.9748 and MA-50 at $2.0177, reinforcing persistent bearish pressure on SUI as these moving averages act as overhead resistance.
Highlights
- SUI trades well below key moving averages, indicating sustained bearish momentum and weak medium- to long-term trend.
- All major momentum indicators signal selling pressure, with oversold conditions underlining strong negative bias from market participants.
- Seven-day outlook projects a trading range between $0.6700 and $0.8200, with a high probability of continued downside or consolidation near lows.
Institutional adoption eyed as privacy upgrade drives sentiment this week
Sui has announced the launch of confidential transfers aimed at enhancing transaction privacy by concealing transfer amounts while preventing unauthorized token minting. This new feature uses range proofs and embeds asset supply conservation at the protocol level, prioritizing privacy and security for both users and institutions. The upgrade is intended to promote institutional adoption and improve confidence in the blockchain’s integrity, though no launch date has been confirmed.
Momentum indicators confirm entrenched bearish trend over the week
On the weekly chart, SUI remains firmly in bearish territory, trading below both the MA-20 and MA-50, which signal medium- and long-term downward momentum. The weekly MACD and ADX each indicate a strong sell, backed by a weekly RSI at 35.25 and a deeply oversold CCI, suggesting strong selling pressure dominates. Stochastic RSI holds a neutral stance, and Bull/Bear Power leans clearly toward sellers, while SUI sits at the bottom of its weekly trading range with volatility at 38.00%.
Limited rebound prospects as technicals flag downside risk in coming week
For the next 7 days, SUI is expected to trade between $0.6700 and $0.8200, reflecting current high volatility and sustained weakness. With all four key weekly indicators showing no Buy or Strong Buy signals, any meaningful rebound has a less than 20% probability, suggesting continued downside or range-bound movement just above current lows. Should sellers lose momentum, there is a chance for a modest move toward the upper boundary, but if bearish pressure persists and SUI closes below $0.6700, further losses toward the yearly low are likely.
Earlier, analysts noted that Sui was experiencing persistent bearish sentiment with little likelihood of a near-term rebound. The current analysis both confirms ongoing downside risk and introduces the prospect that SUI’s launch of confidential transfers may help shape future sentiment, with a break below $0.6700 now posing a significant signal for further losses.


-
 Afghanistan
-
 Albania
-
 Algeria
-
 Angola
-
 Argentina
-
 Armenia
-
 Australia
-
 Austria
-
 Azerbaijan
-
 Bahamas
-
 Bahrain
-
 Bangladesh
-
 Belarus
-
 Belgium
-
 Bolivia
-
 Botswana
-
 Brazil
-
 Brunei
-
 Bulgaria
-
 Cambodia
-
 Cameroon
-
 Canada
-
 Chile
Chile
-
 China
China
-
 Colombia
-
 Congo
Congo
-
 Costa Rica
-
 Cote d'Ivoire
-
 Croatia
-
 Cuba
Cuba
-
 Cyprus
-
 Czechia
-
 DR Congo
-
 Denmark
-
 Dominican Republic
-
 Ecuador
-
 Egypt
Egypt
-
 El Salvador
-
 Estonia
-
 Eswatini
-
 Ethiopia
-
 Finland
-
 France
-
 Georgia
-
 Germany
-
 Ghana
Ghana
-
 Greece
-
 Haiti
Haiti
-
 Hong Kong
-
 Hungary
-
 India
India
-
 Indonesia
-
 Iran, Islamic republic
-
 Iraq
Iraq
-
 Ireland
-
 Israel
-
 Italy
Italy
-
 Jamaica
-
 Japan
Japan
-
 Jordan
-
 Kazakhstan
-
 Kenya
Kenya
-
 Korea
Korea
-
 Kuwait
-
 Kyrgyzstan
-
 Laos
Laos
-
 Latvia
-
 Lebanon
-
 Lesotho
-
 Libya
Libya
-
 Lithuania
-
 Luxembourg
-
 Madagascar
-
 Malaysia
-
 Malta
Malta
-
 Mauritius
-
 Mexico
-
 Moldova
-
 Mongolia
-
 Montenegro
-
 Morocco
-
 Mozambique
-
 Myanmar
-
 Namibia
-
 Nepal
Nepal
-
 Netherlands
-
 New Zealand
-
 Nigeria
-
 North Macedonia
-
 Norway
-
 Oman
Oman
-
 Pakistan
-
 Palestine
-
 Panama
-
 Papua New Guinea
-
 Paraguay
-
 Peru
Peru
-
 Philippines
-
 Poland
-
 Portugal
-
 Puerto Rico
-
 Qatar
Qatar
-
 Reunion
-
 Romania
-
 Rwanda
-
 Saudi Arabia
-
 Serbia
-
 Singapore
-
 Slovakia
-
 Slovenia
-
 Somalia
-
 South Africa
-
 Spain
Spain
-
 Sri Lanka
-
 Sweden
-
 Switzerland
-
 Syria
Syria
-
 Taiwan
-
 Tajikistan
-
 Tanzania
-
 Thailand
-
 Trinidad and Tobago
-
 Tunisia
-
 Turkey
-
 UAE
UAE
-
 Uganda
-
 Ukraine
-
 United Kingdom
-
United States
-
 Uruguay
-
 Uzbekistan
-
 Venezuela
-
 Vietnam
-
 Yemen
Yemen
-
 Zambia
-
 Zimbabwe
- Forex
- Crypto
