
Tezos rises as short-term buyers keep control despite volatility

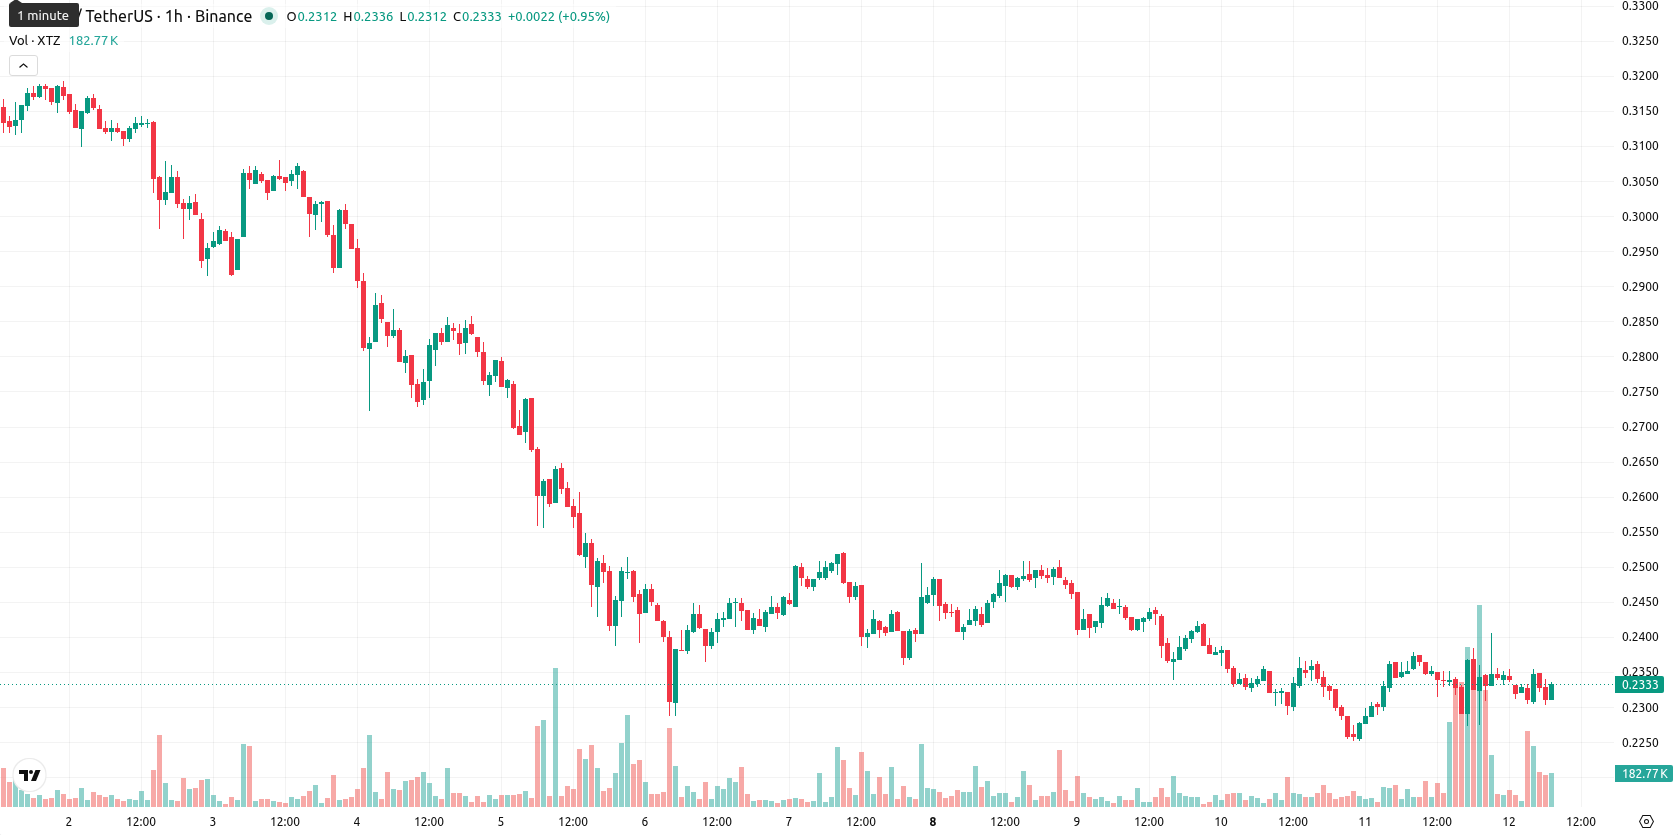
Tezos (XTZ) is trading at $0.2514, up 6.66% for the day. The asset is holding above its key short- and medium-term moving averages, maintaining positive momentum in the current session.
Highlights
- XTZ/USD shows short- and medium-term bullish momentum, yet the longer-term trend remains bearish overall.
- Recent price action saw a 6.66% jump to $0.25140000 amid elevated volatility and strong intraday buying pressure.
- With a projected 2–3 day range of $0.21560000 to $0.25743738, sideways movement is favored and downside risks dominate at 67% probability.
Bullish bias persists as long-term resistance limits upside
XTZ/USD has surged to $0.25140000, trading above its SMA-20 and SMA-50 levels but remains well below its SMA-200, highlighting a continued gap relative to long-term trend resistance. The Ichimoku Kijun provides immediate support at $0.24035000. MACD and ADX both indicate ongoing bullish momentum on the prevailing timeframe, and RSI signals a buy. However, CCI's overbought reading and neutral signals from Stoch RSI and Awesome Oscillator underscore diverging short-term technicals. BBP points to strong buyer dominance intraday while elevated volatility persists.
Range-bound trading seen as downside risk prevails
In the next 2 to 3 days, XTZ/USD is expected to trade between $0.21560000 and $0.25743738, a typical volatility band relative to current levels. The probability of an upward breakout is estimated at 33%, while a downward move is more likely at 67%. The baseline scenario is for the price to oscillate sideways within this range; a bullish scenario would see the price pushing beyond resistance to test the upper band, while a breakdown below immediate support could open the door to further declines.
Earlier, analysts noted that Tezos faced strong selling pressure and was at an inflection point, with technical signals reflecting heightened uncertainty and volatility. The current session’s sustained positive momentum above short- and medium-term moving averages adds dimension to the prior outlook, making the likelihood of a sideways move within the projected range the prevailing scenario to track for near-term positioning.


Latest Tezos News


-
 Afghanistan
-
 Albania
-
 Algeria
-
 Angola
-
 Argentina
-
 Armenia
-
 Australia
-
 Austria
-
 Azerbaijan
-
 Bahamas
-
 Bahrain
-
 Bangladesh
-
 Belarus
-
 Belgium
-
 Bolivia
-
 Botswana
-
 Brazil
-
 Brunei
-
 Bulgaria
-
 Cambodia
-
 Cameroon
-
 Canada
-
 Chile
Chile
-
 China
China
-
 Colombia
-
 Congo
Congo
-
 Costa Rica
-
 Cote d'Ivoire
-
 Croatia
-
 Cuba
Cuba
-
 Cyprus
-
 Czechia
-
 DR Congo
-
 Denmark
-
 Dominican Republic
-
 Ecuador
-
 Egypt
Egypt
-
 El Salvador
-
 Estonia
-
 Eswatini
-
 Ethiopia
-
 Finland
-
 France
-
 Georgia
-
 Germany
-
 Ghana
Ghana
-
 Greece
-
 Haiti
Haiti
-
 Hong Kong
-
 Hungary
-
 India
India
-
 Indonesia
-
 Iran, Islamic republic
-
 Iraq
Iraq
-
 Ireland
-
 Israel
-
 Italy
Italy
-
 Jamaica
-
 Japan
Japan
-
 Jordan
-
 Kazakhstan
-
 Kenya
Kenya
-
 Korea
Korea
-
 Kuwait
-
 Kyrgyzstan
-
 Laos
Laos
-
 Latvia
-
 Lebanon
-
 Lesotho
-
 Libya
Libya
-
 Lithuania
-
 Luxembourg
-
 Madagascar
-
 Malaysia
-
 Malta
Malta
-
 Mauritius
-
 Mexico
-
 Moldova
-
 Mongolia
-
 Montenegro
-
 Morocco
-
 Mozambique
-
 Myanmar
-
 Namibia
-
 Nepal
Nepal
-
 Netherlands
-
 New Zealand
-
 Nigeria
-
 North Macedonia
-
 Norway
-
 Oman
Oman
-
 Pakistan
-
 Palestine
-
 Panama
-
 Papua New Guinea
-
 Paraguay
-
 Peru
Peru
-
 Philippines
-
 Poland
-
 Portugal
-
 Puerto Rico
-
 Qatar
Qatar
-
 Reunion
-
 Romania
-
 Rwanda
-
 Saudi Arabia
-
 Serbia
-
 Singapore
-
 Slovakia
-
 Slovenia
-
 Somalia
-
 South Africa
-
 Spain
Spain
-
 Sri Lanka
-
 Sweden
-
 Switzerland
-
 Syria
Syria
-
 Taiwan
-
 Tajikistan
-
 Tanzania
-
 Thailand
-
 Trinidad and Tobago
-
 Tunisia
-
 Turkey
-
 UAE
UAE
-
 Uganda
-
 Ukraine
-
 United Kingdom
-
United States
-
 Uruguay
-
 Uzbekistan
-
 Venezuela
-
 Vietnam
-
 Yemen
Yemen
-
 Zambia
-
 Zimbabwe
- Forex
- Crypto
