
RNDR ticks up with oversold RSI conditions and dynamic resistance overhead: weekly analysis

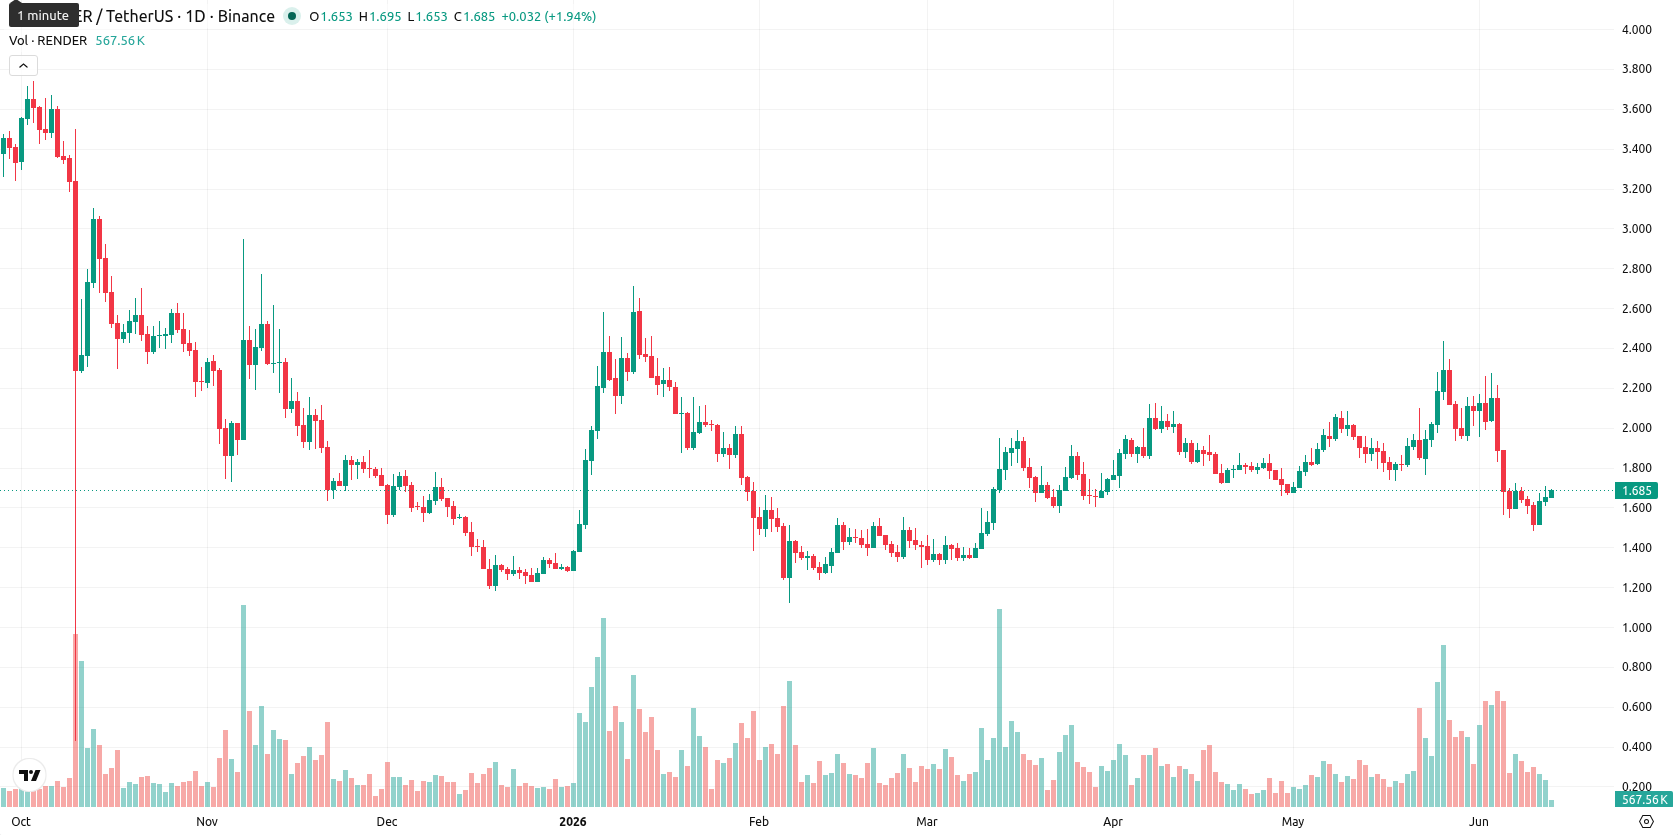
Render (RNDR) is currently trading at $1.685, positioned slightly below the weekly MA-20 ($1.6979) and well under the MA-50 ($2,3729). Over the past week, RNDR has risen $0.061 (3.63%), placing it at the very top of its weekly range and reflecting a mild recovery amidst ongoing selling pressure.
Highlights
- Render remains under medium- and long-term selling pressure, trading below key moving averages and facing dynamic resistance.
- Momentum indicators show a weak and oversold market, with dominant selling and no strong trend or buy signals present.
- Expected trading range for the week is $1.48 to $1.85, with sideways movement likely and a higher probability of downside.
Persistent weak momentum as sellers keep RNDR below resistance
Weekly technicals reflect a weak momentum picture. The MACD gives a strong sell signal on the weekly chart, while the ADX remains neutral and does not support a clear trend. RSI and Stochastic RSI both indicate oversold conditions, yet the Commodity Channel Index is neutral and Bull/Bear Power stays negative, pointing to continued dominance by sellers. Price sits just under the MA-20, with this level acting as dynamic resistance, and remains far below the MA-50.
Sideways bias projected as weak signals cap breakout risk next week
For the next 7 days, RNDR is expected to trade between $1.48 and $1.85 given current volatility levels. The baseline scenario is sideways movement within this range, as no major weekly indicators point to a buy opportunity. A close above $1.85 would indicate a possible reclaiming of the short-term trend, while a move below $1.48 could open the way for further losses. Upward movement has less than a 20% probability based on current weekly data.
Previously it was reported that Render was transitioning from a bearish to a more balanced, rangebound setup, with technical signals highlighting both buyer and seller influences. The current analysis reinforces the persistence of weak momentum and seller dominance, making a decisive close above the MA-20 a crucial threshold for any near-term shift toward sustained upside.


-
 Afghanistan
-
 Albania
-
 Algeria
-
 Angola
-
 Argentina
-
 Armenia
-
 Australia
-
 Austria
-
 Azerbaijan
-
 Bahamas
-
 Bahrain
-
 Bangladesh
-
 Belarus
-
 Belgium
-
 Bolivia
-
 Botswana
-
 Brazil
-
 Brunei
-
 Bulgaria
-
 Cambodia
-
 Cameroon
-
 Canada
-
 Chile
Chile
-
 China
China
-
 Colombia
-
 Congo
Congo
-
 Costa Rica
-
 Cote d'Ivoire
-
 Croatia
-
 Cuba
Cuba
-
 Cyprus
-
 Czechia
-
 DR Congo
-
 Denmark
-
 Dominican Republic
-
 Ecuador
-
 Egypt
Egypt
-
 El Salvador
-
 Estonia
-
 Eswatini
-
 Ethiopia
-
 Finland
-
 France
-
 Georgia
-
 Germany
-
 Ghana
Ghana
-
 Greece
-
 Haiti
Haiti
-
 Hong Kong
-
 Hungary
-
 India
India
-
 Indonesia
-
 Iran, Islamic republic
-
 Iraq
Iraq
-
 Ireland
-
 Israel
-
 Italy
Italy
-
 Jamaica
-
 Japan
Japan
-
 Jordan
-
 Kazakhstan
-
 Kenya
Kenya
-
 Korea
Korea
-
 Kuwait
-
 Kyrgyzstan
-
 Laos
Laos
-
 Latvia
-
 Lebanon
-
 Lesotho
-
 Libya
Libya
-
 Lithuania
-
 Luxembourg
-
 Madagascar
-
 Malaysia
-
 Malta
Malta
-
 Mauritius
-
 Mexico
-
 Moldova
-
 Mongolia
-
 Montenegro
-
 Morocco
-
 Mozambique
-
 Myanmar
-
 Namibia
-
 Nepal
Nepal
-
 Netherlands
-
 New Zealand
-
 Nigeria
-
 North Macedonia
-
 Norway
-
 Oman
Oman
-
 Pakistan
-
 Palestine
-
 Panama
-
 Papua New Guinea
-
 Paraguay
-
 Peru
Peru
-
 Philippines
-
 Poland
-
 Portugal
-
 Puerto Rico
-
 Qatar
Qatar
-
 Reunion
-
 Romania
-
 Rwanda
-
 Saudi Arabia
-
 Serbia
-
 Singapore
-
 Slovakia
-
 Slovenia
-
 Somalia
-
 South Africa
-
 Spain
Spain
-
 Sri Lanka
-
 Sweden
-
 Switzerland
-
 Syria
Syria
-
 Taiwan
-
 Tajikistan
-
 Tanzania
-
 Thailand
-
 Trinidad and Tobago
-
 Tunisia
-
 Turkey
-
 UAE
UAE
-
 Uganda
-
 Ukraine
-
 United Kingdom
-
United States
-
 Uruguay
-
 Uzbekistan
-
 Venezuela
-
 Vietnam
-
 Yemen
Yemen
-
 Zambia
-
 Zimbabwe
- Forex
- Crypto
