
Stellar price prediction: Will $0.2020–$0.2308 range hold as XLM surges 14.50%?

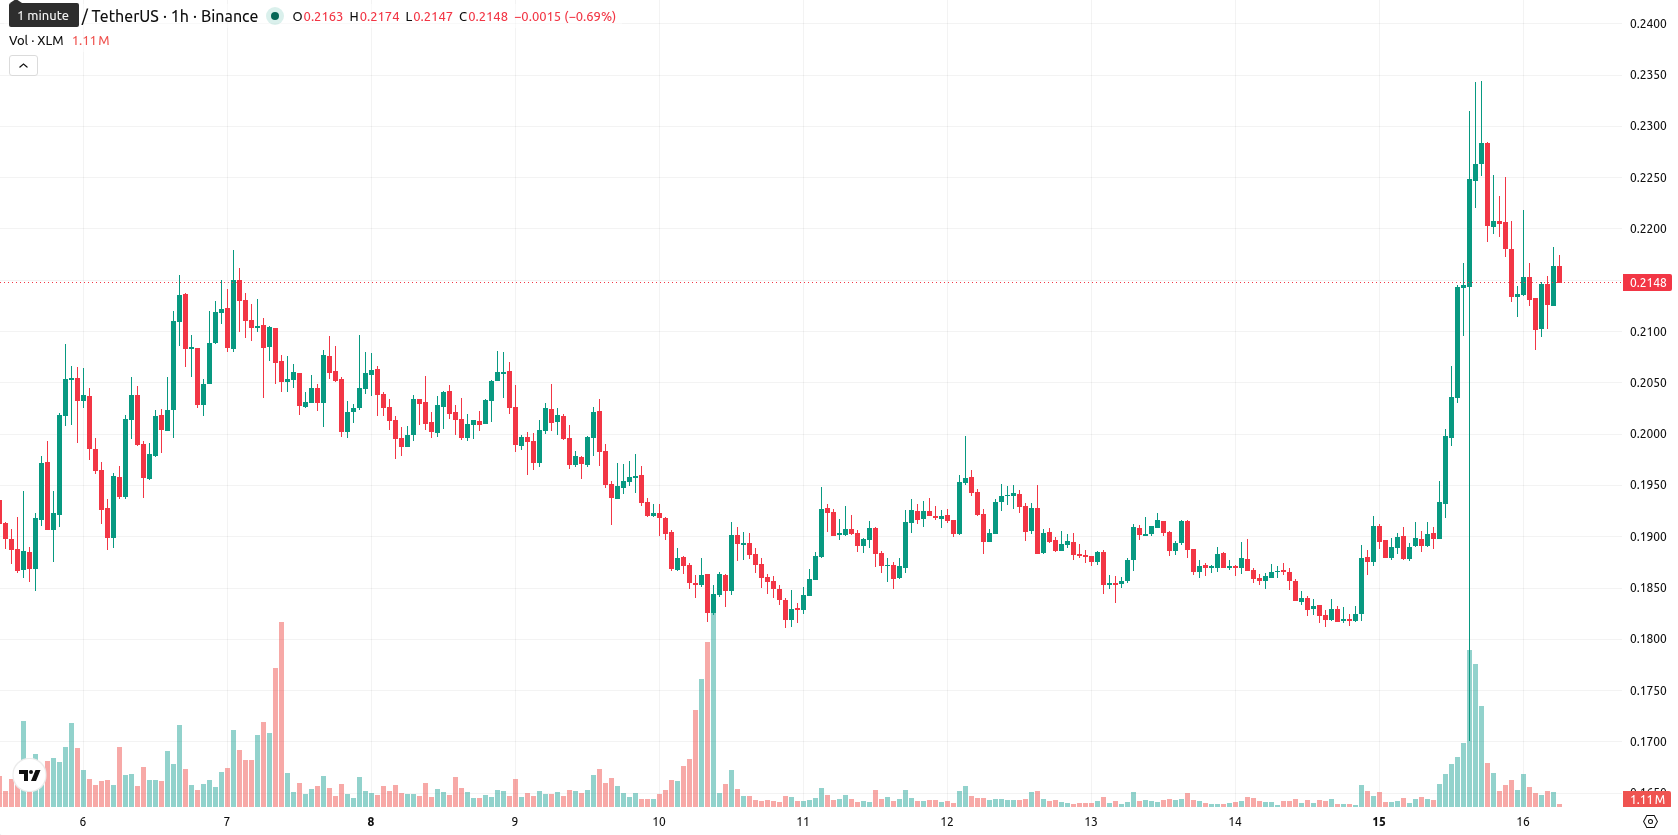
Stellar (XLM) is trading at $0.2164 after climbing 14.5% on the day, with the price currently remaining above its key moving averages. This marks a strong move higher as bullish momentum dominates intraday trading.
Highlights
- The SEC's approval of the T. Rowe Price Active Crypto ETF, now including XLM, has catalyzed institutional access and heightened regulatory confidence in Stellar's infrastructure.
- XLM trading and futures volumes surged sharply—spot volume by approximately 500% and futures nearly doubling to $372.6 million—underscoring robust liquidity and increased market engagement.
- XLM/USD shows bullish momentum with strong buyer activity, a projected $0.2020–$0.2308 trading range, and a 62% probability of an upward move in the next 2–3 days.
Institutional inflows surge as ETF approval drives both demand and liquidity
The U.S. SEC's approval of the T. Rowe Price Active Crypto ETF, which now includes XLM as an eligible asset, is providing a significant entry point for institutional investors and increasing regulatory confidence in Stellar’s market infrastructure. This action facilitates new demand channels via regulated ETF exposure and is accompanied by an approximately 500% surge in XLM trading volume, as reported, underscoring heightened liquidity and market engagement. Secondary developments include nearly doubling futures volume to $372.6 million within 24 hours and Anchorage Digital's launch of institutional custody for tokenized Mexican government debt (CETES) on Stellar, expanding both its network’s adoption and the scope of asset support.
Momentum conflict as technicals signal bullish edge despite trend divergence
Technically, XLM/USD is trading above its MA-20 at $0.2133 and its MA-50 at $0.1969 on the hourly chart, as well as above the daily MA-200 at $0.1867. The Ichimoku Kijun level on the daily timeframe sits at $0.2022, marking a notable support area. Momentum indicators are mixed: MACD signals Strong Buy, whereas ADX points to a Sell, highlighting a divergence between trend strength and its direction. RSI is at 54.1353 (Buy), Stoch RSI is Oversold, and CCI remains Neutral, while BBP issues a Buy and AO is Neutral, resulting in a complex but predominantly bullish technical backdrop.
Sideways bias likely as volatility bands contain upside breakout risk
Looking ahead to the next 2–3 trading days, XLM/USD is likely to fluctuate within a volatility band of $0.2020 to $0.2308. There is a 62% probability of an upward move, with the baseline scenario expecting sideways action inside this range. If bullish momentum persists, a breakout toward the upper end is possible, while a sustained drop below the $0.2022 support could trigger deeper declines.
Earlier, analysts noted that Stellar's outlook was broadly bullish, underpinned by strong buyer momentum and resilient network fundamentals amid mixed short-term signals. The current surge in institutional interest and trading volume, paired with positive market structure developments, strengthens this view and suggests that traders should closely watch for signs of a decisive breakout toward the $0.2308 level in the coming days.


Latest Stellar News


-
 Afghanistan
-
 Albania
-
 Algeria
-
 Angola
-
 Argentina
-
 Armenia
-
 Australia
-
 Austria
-
 Azerbaijan
-
 Bahamas
-
 Bahrain
-
 Bangladesh
-
 Belarus
-
 Belgium
-
 Bolivia
-
 Botswana
-
 Brazil
-
 Brunei
-
 Bulgaria
-
 Cambodia
-
 Cameroon
-
 Canada
-
 Chile
Chile
-
 China
China
-
 Colombia
-
 Congo
Congo
-
 Costa Rica
-
 Cote d'Ivoire
-
 Croatia
-
 Cuba
Cuba
-
 Cyprus
-
 Czechia
-
 DR Congo
-
 Denmark
-
 Dominican Republic
-
 Ecuador
-
 Egypt
Egypt
-
 El Salvador
-
 Estonia
-
 Eswatini
-
 Ethiopia
-
 Finland
-
 France
-
 Georgia
-
 Germany
-
 Ghana
Ghana
-
 Greece
-
 Haiti
Haiti
-
 Hong Kong
-
 Hungary
-
 India
India
-
 Indonesia
-
 Iran, Islamic republic
-
 Iraq
Iraq
-
 Ireland
-
 Israel
-
 Italy
Italy
-
 Jamaica
-
 Japan
Japan
-
 Jordan
-
 Kazakhstan
-
 Kenya
Kenya
-
 Korea
Korea
-
 Kuwait
-
 Kyrgyzstan
-
 Laos
Laos
-
 Latvia
-
 Lebanon
-
 Lesotho
-
 Libya
Libya
-
 Lithuania
-
 Luxembourg
-
 Madagascar
-
 Malaysia
-
 Malta
Malta
-
 Mauritius
-
 Mexico
-
 Moldova
-
 Mongolia
-
 Montenegro
-
 Morocco
-
 Mozambique
-
 Myanmar
-
 Namibia
-
 Nepal
Nepal
-
 Netherlands
-
 New Zealand
-
 Nigeria
-
 North Macedonia
-
 Norway
-
 Oman
Oman
-
 Pakistan
-
 Palestine
-
 Panama
-
 Papua New Guinea
-
 Paraguay
-
 Peru
Peru
-
 Philippines
-
 Poland
-
 Portugal
-
 Puerto Rico
-
 Qatar
Qatar
-
 Reunion
-
 Romania
-
 Rwanda
-
 Saudi Arabia
-
 Serbia
-
 Singapore
-
 Slovakia
-
 Slovenia
-
 Somalia
-
 South Africa
-
 Spain
Spain
-
 Sri Lanka
-
 Sweden
-
 Switzerland
-
 Syria
Syria
-
 Taiwan
-
 Tajikistan
-
 Tanzania
-
 Thailand
-
 Trinidad and Tobago
-
 Tunisia
-
 Turkey
-
 UAE
UAE
-
 Uganda
-
 Ukraine
-
 United Kingdom
-
United States
-
 Uruguay
-
 Uzbekistan
-
 Venezuela
-
 Vietnam
-
 Yemen
Yemen
-
 Zambia
-
 Zimbabwe
- Forex
- Crypto
