
NEAR drops 8.21% as sellers push price below short-term averages

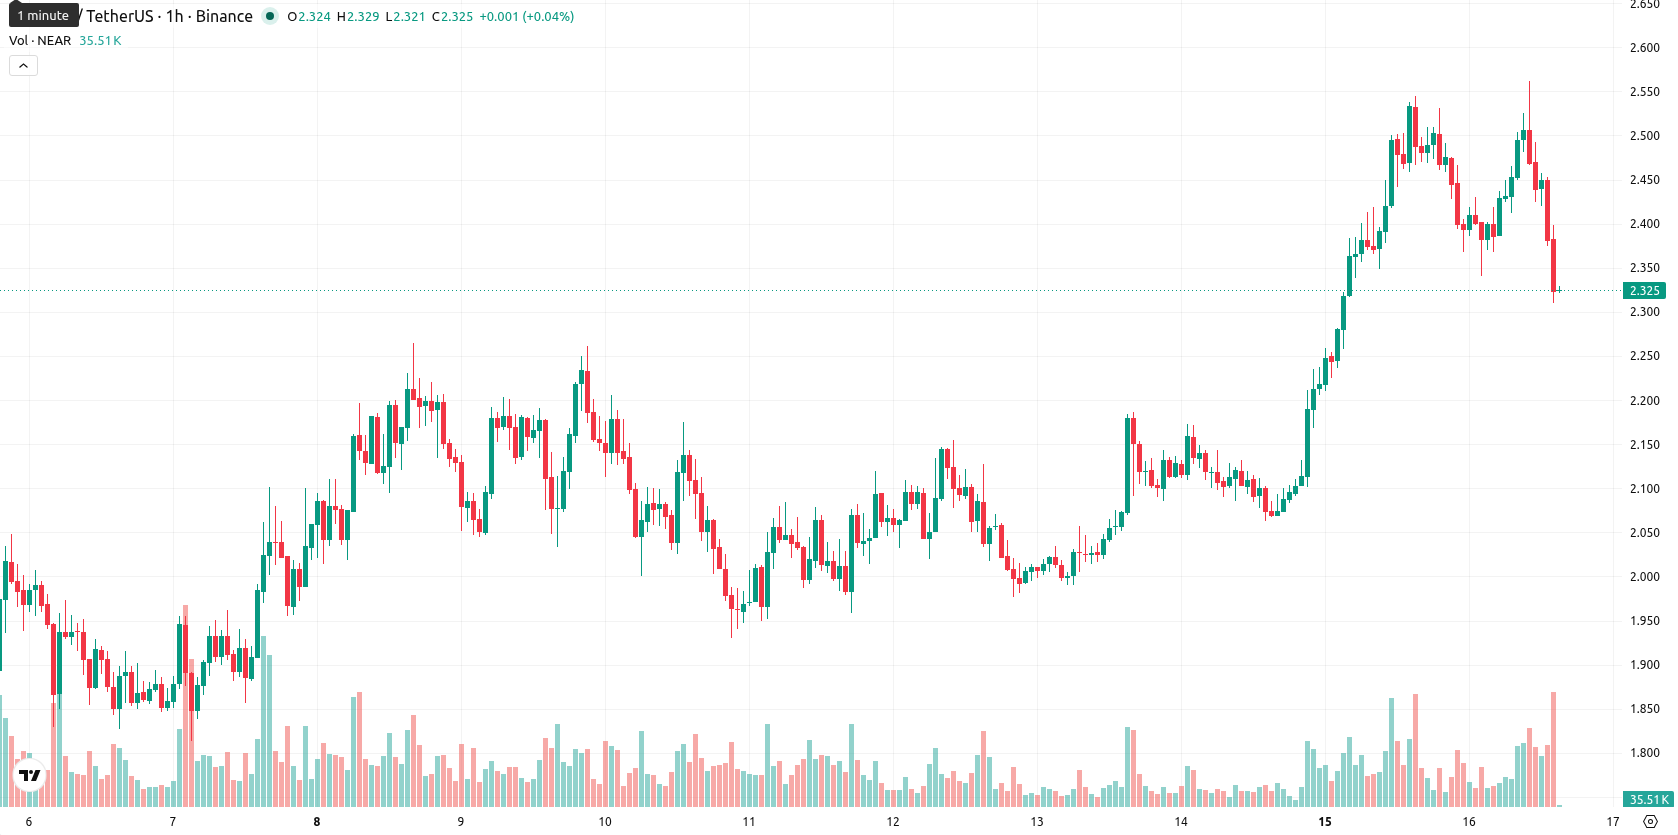
NEAR (NEAR) is trading at $2.3250, down 8.21% for the session, and currently sits below its key short- and medium-term moving averages while remaining above long-term levels.
Highlights
- NEAR trades below important short- and medium-term averages but holds above a long-term support, reflecting mixed momentum and uncertainty.
- Volatility is elevated after an 8.21% price drop to $2.3250, with intraday action confirming persistent selling pressure.
- Expect NEAR to consolidate between $2.1875 and $2.4625 in the coming days, with resistance and support at those boundaries and a modest upside bias.
Mixed indicators highlight volatility amid sustained selling pressure
The price has moved below the MA-20 and MA-50 levels, suggesting recent selling pressure in both short- and medium-term contexts, but continues to rest above the long-term MA-200, which serves as support. The Ichimoku Kijun level currently stands as immediate resistance at $2.4490. MACD reflects strong buying momentum, while ADX signals a buy, yet the RSI is at 46.7 (Sell), Stoch RSI is in oversold territory, and CCI maintains a bearish stance. Bull/Bear Power (BBP) shows some buyer strength; however, the Awesome Oscillator (AO) is neutral, providing no confirmation of prevailing momentum. The combination of mixed indicator signals and high volatility aligns with underlying market uncertainty, with evidence of short-term selling pressure.
Sideways consolidation seen as breakout risks emerge
Over the next several sessions, NEAR is expected to fluctuate within a typical volatility band defined by a support level at $2.1875 and resistance at $2.4625. The baseline scenario favors consolidation sideways within this range, with a 55% probability of an upward move and a 45% chance of further decline. A bullish breakout would be confirmed on a sustained move above the $2.4490 resistance, whereas a breakdown below $2.1875 support would signal renewed downside risk.
Earlier, analysts noted that NEAR was maintaining a strong bullish structure across all major timeframes. The current shift below key short- and medium-term moving averages introduces a more cautious outlook, making sustained moves above $2.4490 or below $2.1875 crucial signals for NEAR’s next direction.


Latest NEAR News


-
 Afghanistan
-
 Albania
-
 Algeria
-
 Angola
-
 Argentina
-
 Armenia
-
 Australia
-
 Austria
-
 Azerbaijan
-
 Bahamas
-
 Bahrain
-
 Bangladesh
-
 Belarus
-
 Belgium
-
 Bolivia
-
 Botswana
-
 Brazil
-
 Brunei
-
 Bulgaria
-
 Cambodia
-
 Cameroon
-
 Canada
-
 Chile
Chile
-
 China
China
-
 Colombia
-
 Congo
Congo
-
 Costa Rica
-
 Cote d'Ivoire
-
 Croatia
-
 Cuba
Cuba
-
 Cyprus
-
 Czechia
-
 DR Congo
-
 Denmark
-
 Dominican Republic
-
 Ecuador
-
 Egypt
Egypt
-
 El Salvador
-
 Estonia
-
 Eswatini
-
 Ethiopia
-
 Finland
-
 France
-
 Georgia
-
 Germany
-
 Ghana
Ghana
-
 Greece
-
 Haiti
Haiti
-
 Hong Kong
-
 Hungary
-
 India
India
-
 Indonesia
-
 Iran, Islamic republic
-
 Iraq
Iraq
-
 Ireland
-
 Israel
-
 Italy
Italy
-
 Jamaica
-
 Japan
Japan
-
 Jordan
-
 Kazakhstan
-
 Kenya
Kenya
-
 Korea
Korea
-
 Kuwait
-
 Kyrgyzstan
-
 Laos
Laos
-
 Latvia
-
 Lebanon
-
 Lesotho
-
 Libya
Libya
-
 Lithuania
-
 Luxembourg
-
 Madagascar
-
 Malaysia
-
 Malta
Malta
-
 Mauritius
-
 Mexico
-
 Moldova
-
 Mongolia
-
 Montenegro
-
 Morocco
-
 Mozambique
-
 Myanmar
-
 Namibia
-
 Nepal
Nepal
-
 Netherlands
-
 New Zealand
-
 Nigeria
-
 North Macedonia
-
 Norway
-
 Oman
Oman
-
 Pakistan
-
 Palestine
-
 Panama
-
 Papua New Guinea
-
 Paraguay
-
 Peru
Peru
-
 Philippines
-
 Poland
-
 Portugal
-
 Puerto Rico
-
 Qatar
Qatar
-
 Reunion
-
 Romania
-
 Rwanda
-
 Saudi Arabia
-
 Serbia
-
 Singapore
-
 Slovakia
-
 Slovenia
-
 Somalia
-
 South Africa
-
 Spain
Spain
-
 Sri Lanka
-
 Sweden
-
 Switzerland
-
 Syria
Syria
-
 Taiwan
-
 Tajikistan
-
 Tanzania
-
 Thailand
-
 Trinidad and Tobago
-
 Tunisia
-
 Turkey
-
 UAE
UAE
-
 Uganda
-
 Ukraine
-
 United Kingdom
-
United States
-
 Uruguay
-
 Uzbekistan
-
 Venezuela
-
 Vietnam
-
 Yemen
Yemen
-
 Zambia
-
 Zimbabwe
- Forex
- Crypto
