
Pendle drops 8.86% as sellers dominate the short-term trend

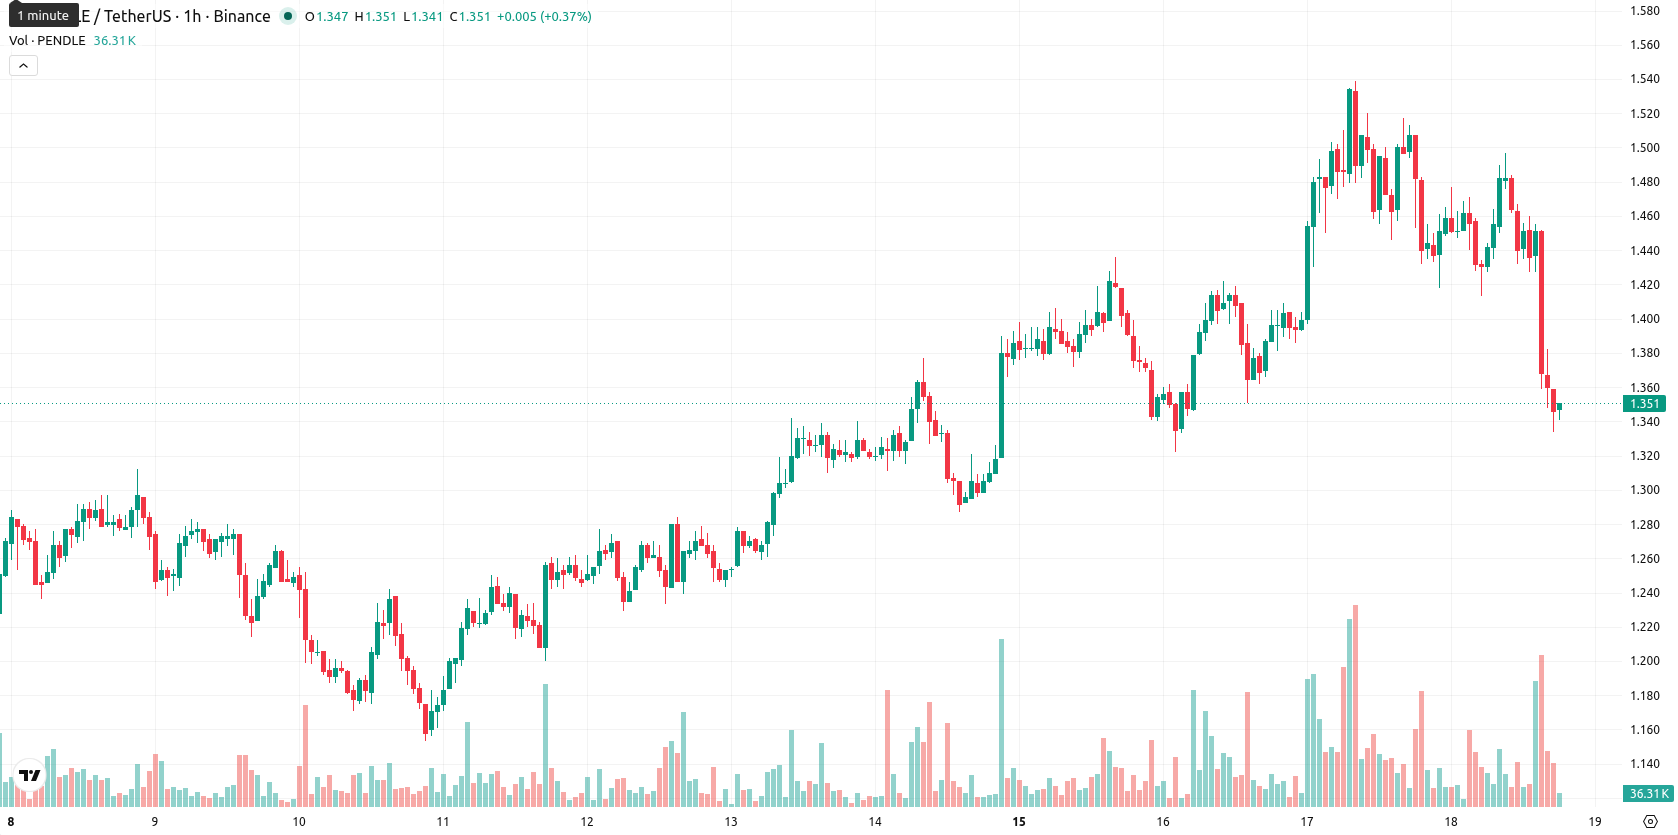
Pendle (PENDLE) is trading at $1.3480, marking a sharp decline of 8.86% from the previous day. The asset is currently positioned below its key moving averages, indicating short-term and long-term weakness.
Highlights
- PENDLE/USD remains under consistent downward pressure across all timeframes, trading below major moving averages and near session lows.
- Momentum indicators confirm a bearish bias, with sell signals and deep oversold readings, showing weak prospects for a near-term reversal.
- The price is forecast to range between $1.2787 and $1.4173, with a high likelihood of further declines if $1.2787 support fails.
Sell signals strengthen as bearish momentum overwhelms support
On the hourly chart, PENDLE/USD is trading below both the MA-20 at $1.4386 and MA-50 at $1.4501, while also remaining under the MA-200 on the daily timeframe at $1.5974. The Ichimoku Kijun level at $1.4255 stands as immediate resistance. Momentum indicators paint a weak picture, with MACD signaling Sell and ADX reading Neutral, indicating little trend strength. The RSI is at a low 31.4 (Sell signal), and both the Stoch RSI and CCI register Oversold, highlighting deep near-term bearish conditions. Bull/Bear Power reflects seller dominance, and Awesome Oscillator confirms the negative momentum.
Downside risk rises as volatility limits recovery prospects
Over the short term, the expected price range for PENDLE is between $1.2787 and $1.4173. Given current volatility, the probability of an upward move is very low, while the likelihood of further declines is notably high. The base case scenario calls for price movement within the current sideways band, but a decisive break above $1.4255 could point to a recovery toward the upper end of the projected range. Conversely, sustained weakness below $1.2787 would expose the asset to deeper downside risk.
Earlier, analysts noted persistent but cautious bullish momentum for Pendle, citing mixed technical signals and the need for vigilance around key resistance levels. The current breakdown below major moving averages with deep oversold readings marks a clear shift to bearish conditions, making sustained downside risk the dominant scenario for now.


-
 Afghanistan
-
 Albania
-
 Algeria
-
 Angola
-
 Argentina
-
 Armenia
-
 Australia
-
 Austria
-
 Azerbaijan
-
 Bahamas
-
 Bahrain
-
 Bangladesh
-
 Belarus
-
 Belgium
-
 Bolivia
-
 Botswana
-
 Brazil
-
 Brunei
-
 Bulgaria
-
 Cambodia
-
 Cameroon
-
 Canada
-
 Chile
Chile
-
 China
China
-
 Colombia
-
 Congo
Congo
-
 Costa Rica
-
 Cote d'Ivoire
-
 Croatia
-
 Cuba
Cuba
-
 Cyprus
-
 Czechia
-
 DR Congo
-
 Denmark
-
 Dominican Republic
-
 Ecuador
-
 Egypt
Egypt
-
 El Salvador
-
 Estonia
-
 Eswatini
-
 Ethiopia
-
 Finland
-
 France
-
 Georgia
-
 Germany
-
 Ghana
Ghana
-
 Greece
-
 Haiti
Haiti
-
 Hong Kong
-
 Hungary
-
 India
India
-
 Indonesia
-
 Iran, Islamic republic
-
 Iraq
Iraq
-
 Ireland
-
 Israel
-
 Italy
Italy
-
 Jamaica
-
 Japan
Japan
-
 Jordan
-
 Kazakhstan
-
 Kenya
Kenya
-
 Korea
Korea
-
 Kuwait
-
 Kyrgyzstan
-
 Laos
Laos
-
 Latvia
-
 Lebanon
-
 Lesotho
-
 Libya
Libya
-
 Lithuania
-
 Luxembourg
-
 Madagascar
-
 Malaysia
-
 Malta
Malta
-
 Mauritius
-
 Mexico
-
 Moldova
-
 Mongolia
-
 Montenegro
-
 Morocco
-
 Mozambique
-
 Myanmar
-
 Namibia
-
 Nepal
Nepal
-
 Netherlands
-
 New Zealand
-
 Nigeria
-
 North Macedonia
-
 Norway
-
 Oman
Oman
-
 Pakistan
-
 Palestine
-
 Panama
-
 Papua New Guinea
-
 Paraguay
-
 Peru
Peru
-
 Philippines
-
 Poland
-
 Portugal
-
 Puerto Rico
-
 Qatar
Qatar
-
 Reunion
-
 Romania
-
 Rwanda
-
 Saudi Arabia
-
 Serbia
-
 Singapore
-
 Slovakia
-
 Slovenia
-
 Somalia
-
 South Africa
-
 Spain
Spain
-
 Sri Lanka
-
 Sweden
-
 Switzerland
-
 Syria
Syria
-
 Taiwan
-
 Tajikistan
-
 Tanzania
-
 Thailand
-
 Trinidad and Tobago
-
 Tunisia
-
 Turkey
-
 UAE
UAE
-
 Uganda
-
 Ukraine
-
 United Kingdom
-
United States
-
 Uruguay
-
 Uzbekistan
-
 Venezuela
-
 Vietnam
-
 Yemen
Yemen
-
 Zambia
-
 Zimbabwe
- Forex
- Crypto
