
XRP price prediction: Can $1.09 support hold as XRP sells off 2.85%?

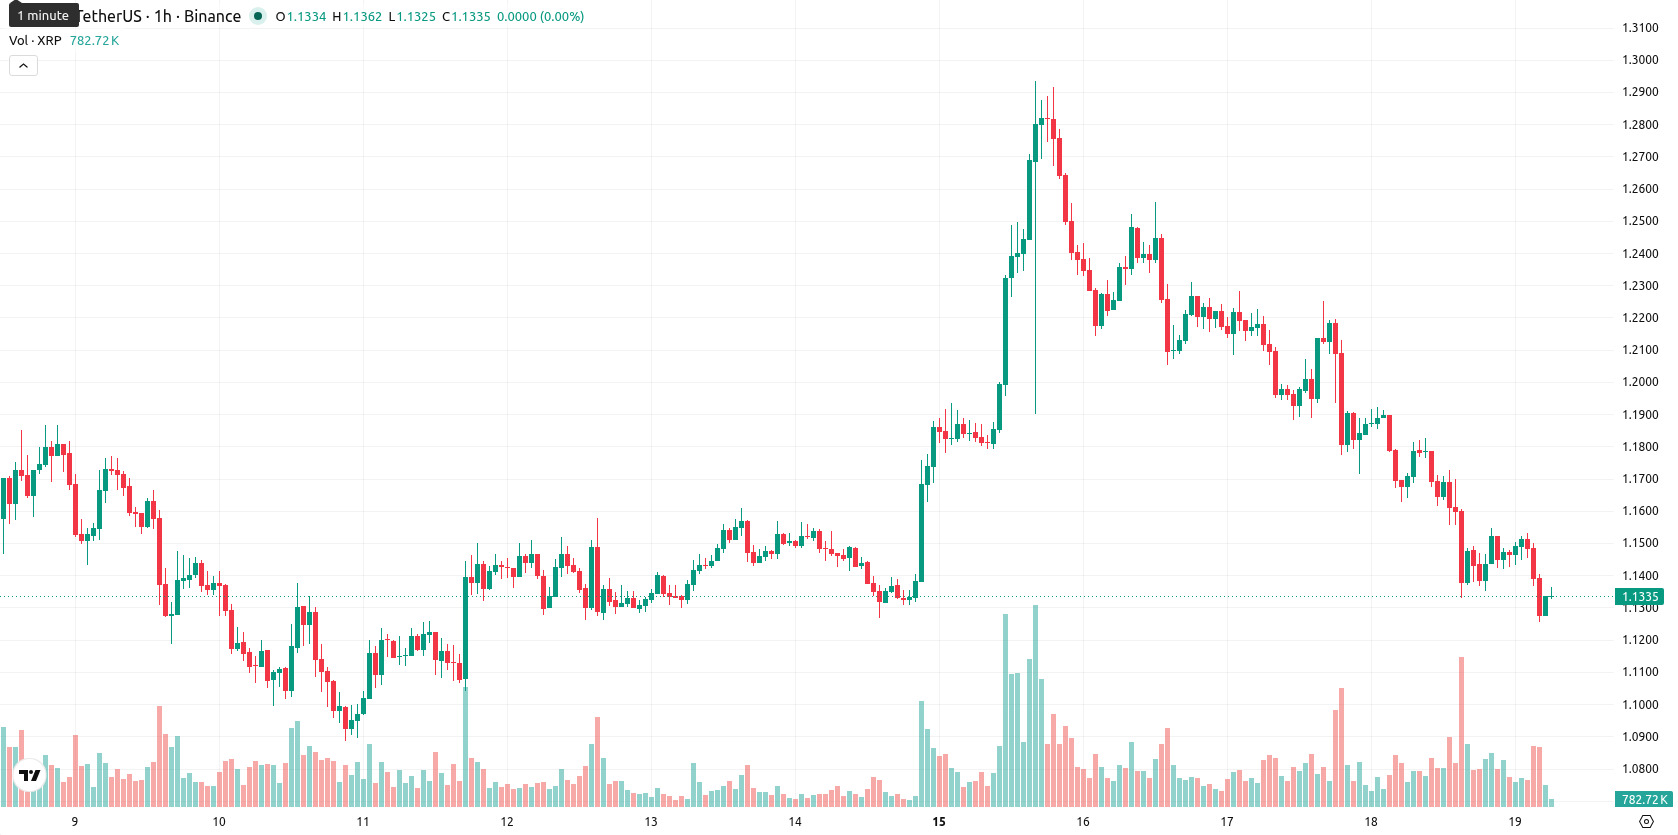
XRP (XRP) is trading at $1.13, posting a daily decline of 2.85%. The asset is positioned below its key moving averages, reflecting continued short-term pressure in the market.
Highlights
- Ripple launched major XRP Ledger upgrades to support XRP's use as regulated institutional DeFi collateral, aiming to strengthen integration with traditional finance.
- Over $153 million flowed into XRP investment products in early 2026, signaling significant institutional demand and adoption momentum.
- Technicals show sustained bearish pressure for XRP/USD, with indicators suggesting a high probability of further downside within the $1.0958–$1.1704 range.
Institutional flows and regulatory initiatives drive volatility in XRP
Ripple has announced a strategic initiative to expand XRP's role as institutional DeFi collateral, enabled by newly introduced XRP Ledger upgrades that add lending tools and regulatory compliance features, according to Markets Businessinsider. This expansion is aimed at broadening the token’s application across institutional finance, creating new pathways for adoption within regulated environments. At the same time, Analyticsinsight reported that over $153 million flowed into XRP investment products in early 2026, indicating increased participation by institutional investors. Meanwhile, a sharp 10% rally and subsequent reversal in XRP/USD on June 18, 2026, reflected heightened volatility and profit-taking activity, factors that have contributed to the present trading dynamics.
Weak momentum and oversold signals as resistance limits rebounds
On the hourly chart, XRP is trading below both the MA-20 of $1.15 and the MA-50 at $1.17, with the daily MA-200 well above at $1.55. The Ichimoku Kijun level sits at $1.15 and acts as immediate resistance for any attempted rebounds. Momentum readings remain weak: MACD signals a strong sell, ADX reflects ongoing selling momentum, while RSI is near oversold at 31.33 and CCI also indicates oversold conditions. The Stoch RSI is neutral, highlighting mixed oscillator signals, and BBP points to continued seller dominance in the intraday session. The Awesome Oscillator offers no added directional confirmation. Current price action is close to the session low, underscoring moderate volatility and a weak sentiment.
Range-bound outlook as upside probability weakens amid downside risk
Over the next 2 to 3 trading days, XRP is expected to fluctuate within a range of $1.09 to $1.17, reflecting its typical volatility band relative to current levels. The probability of a move higher is considered very low under existing conditions, while the risk of further downside remains elevated. A baseline scenario envisions sideways drift inside this corridor, with a bullish case only possible following a confirmed breakout above the immediate resistance. Conversely, further selling pressure may accelerate if the asset breaks below the support at $1.09.
Earlier, analysts noted that XRP was experiencing persistent downward momentum, characterized by ongoing selling pressure and a lack of definitive bullish signals. The current analysis reinforces this bearish outlook amid institutional inflows and recent volatility, highlighting that a decisive move above $1.15 resistance or below $1.09 support will likely dictate the next significant trend.


Latest XRP News


-
 Afghanistan
-
 Albania
-
 Algeria
-
 Angola
-
 Argentina
-
 Armenia
-
 Australia
-
 Austria
-
 Azerbaijan
-
 Bahamas
-
 Bahrain
-
 Bangladesh
-
 Belarus
-
 Belgium
-
 Bolivia
-
 Botswana
-
 Brazil
-
 Brunei
-
 Bulgaria
-
 Cambodia
-
 Cameroon
-
 Canada
-
 Chile
Chile
-
 China
China
-
 Colombia
-
 Congo
Congo
-
 Costa Rica
-
 Cote d'Ivoire
-
 Croatia
-
 Cuba
Cuba
-
 Cyprus
-
 Czechia
-
 DR Congo
-
 Denmark
-
 Dominican Republic
-
 Ecuador
-
 Egypt
Egypt
-
 El Salvador
-
 Estonia
-
 Eswatini
-
 Ethiopia
-
 Finland
-
 France
-
 Georgia
-
 Germany
-
 Ghana
Ghana
-
 Greece
-
 Haiti
Haiti
-
 Hong Kong
-
 Hungary
-
 India
India
-
 Indonesia
-
 Iran, Islamic republic
-
 Iraq
Iraq
-
 Ireland
-
 Israel
-
 Italy
Italy
-
 Jamaica
-
 Japan
Japan
-
 Jordan
-
 Kazakhstan
-
 Kenya
Kenya
-
 Korea
Korea
-
 Kuwait
-
 Kyrgyzstan
-
 Laos
Laos
-
 Latvia
-
 Lebanon
-
 Lesotho
-
 Libya
Libya
-
 Lithuania
-
 Luxembourg
-
 Madagascar
-
 Malaysia
-
 Malta
Malta
-
 Mauritius
-
 Mexico
-
 Moldova
-
 Mongolia
-
 Montenegro
-
 Morocco
-
 Mozambique
-
 Myanmar
-
 Namibia
-
 Nepal
Nepal
-
 Netherlands
-
 New Zealand
-
 Nigeria
-
 North Macedonia
-
 Norway
-
 Oman
Oman
-
 Pakistan
-
 Palestine
-
 Panama
-
 Papua New Guinea
-
 Paraguay
-
 Peru
Peru
-
 Philippines
-
 Poland
-
 Portugal
-
 Puerto Rico
-
 Qatar
Qatar
-
 Reunion
-
 Romania
-
 Rwanda
-
 Saudi Arabia
-
 Serbia
-
 Singapore
-
 Slovakia
-
 Slovenia
-
 Somalia
-
 South Africa
-
 Spain
Spain
-
 Sri Lanka
-
 Sweden
-
 Switzerland
-
 Syria
Syria
-
 Taiwan
-
 Tajikistan
-
 Tanzania
-
 Thailand
-
 Trinidad and Tobago
-
 Tunisia
-
 Turkey
-
 UAE
UAE
-
 Uganda
-
 Ukraine
-
 United Kingdom
-
United States
-
 Uruguay
-
 Uzbekistan
-
 Venezuela
-
 Vietnam
-
 Yemen
Yemen
-
 Zambia
-
 Zimbabwe
- Forex
- Crypto
