
The Graph holds steady within recent $0.0170 to $0.0202 range with bearish momentum: weekly analysis

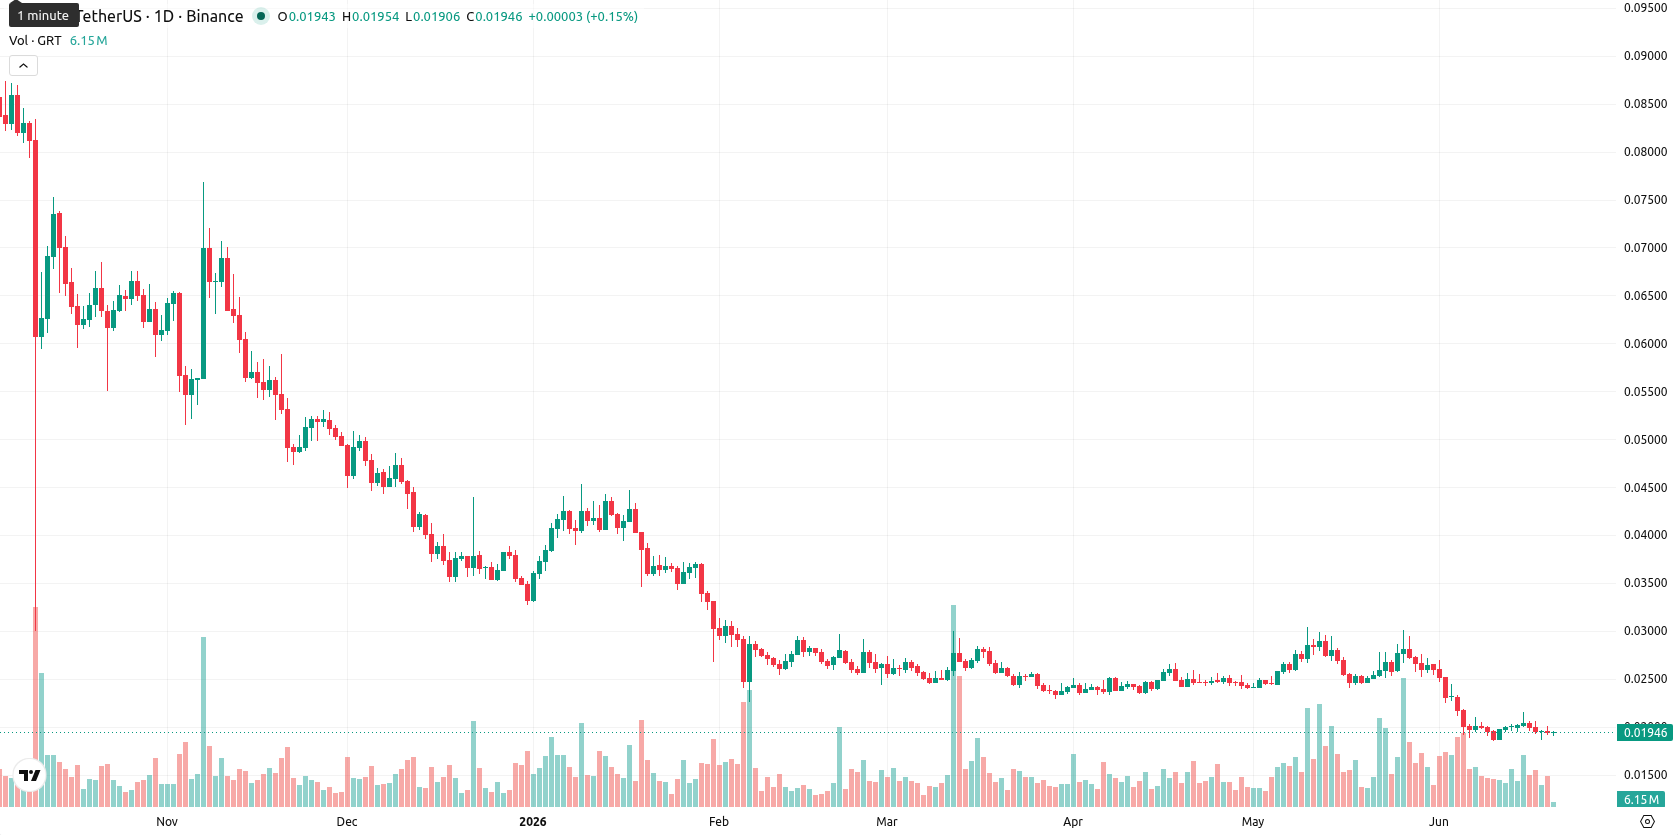
The Graph (GRT) is currently trading at $0.01941, marking a decrease of $0.0002 (1.02%) over the past week. The asset remains firmly below its key weekly moving averages — MA-20 at $0.02465300, MA-50 at $0.05122580, and MA-200 at $0.12728195 — confirming that medium- and longer-term trends continue to be bearish.
Highlights
- GRT trades firmly below major moving averages, confirming a sustained bearish trend with downward momentum prevailing.
- Technical indicators show negative momentum and persistent seller dominance, though oversold signals suggest potential for a slowing decline.
- For the next week, GRT is likely to range between $0.0170 and $0.0202, with a low probability of any significant rebound.
Bearish momentum intensifies as weekly indicators confirm negative bias
On the weekly timeframe, key indicators reinforce the bearish outlook for GRT. The price trades beneath all major weekly moving averages, with the MA-20 acting as immediate dynamic resistance. The RSI has reached 29, signaling oversold levels, while the Commodity Channel Index also reflects oversold conditions. Momentum remains negative, with persistent downtrend signals from both the MACD and ADX, and the Awesome Oscillator supports continued downward movement. Volatility is elevated at 15.95%, and sellers dominate as shown by Bull/Bear Power, while Stochastic RSI stays neutral. Weekly support is found at $0.0170 and resistance is at $0.0202.
Downside risk persists for next week amid weak reversal signals
For the coming 7 days, the outlook remains bearish for GRT, with the most probable scenario being sideways action in the $0.0170 to $0.0202 range. The oversold readings on the weekly chart suggest some likelihood of stabilization, but with none of the four main indicators signaling a buy, a further decline cannot be ruled out. If the price breaks below $0.0170, additional losses may accelerate, while a move above $0.0202 would be required to signal the start of any meaningful recovery. The probability of a significant upside move remains low, below 20% based on current weekly data.
Earlier, analysts noted that The Graph had shifted to strong bullish momentum, with traders watching for a potential breakout driven by heightened volatility. The current downturn signals a sharp reversal in sentiment, and with key indicators now deep in oversold territory, traders should closely monitor the $0.0170 weekly support for any signs of further breakdown or stabilization.


Latest GRT News


-
 Afghanistan
-
 Albania
-
 Algeria
-
 Angola
-
 Argentina
-
 Armenia
-
 Australia
-
 Austria
-
 Azerbaijan
-
 Bahamas
-
 Bahrain
-
 Bangladesh
-
 Belarus
-
 Belgium
-
 Bolivia
-
 Botswana
-
 Brazil
-
 Brunei
-
 Bulgaria
-
 Cambodia
-
 Cameroon
-
 Canada
-
 Chile
Chile
-
 China
China
-
 Colombia
-
 Congo
Congo
-
 Costa Rica
-
 Cote d'Ivoire
-
 Croatia
-
 Cuba
Cuba
-
 Cyprus
-
 Czechia
-
 DR Congo
-
 Denmark
-
 Dominican Republic
-
 Ecuador
-
 Egypt
Egypt
-
 El Salvador
-
 Estonia
-
 Eswatini
-
 Ethiopia
-
 Finland
-
 France
-
 Georgia
-
 Germany
-
 Ghana
Ghana
-
 Greece
-
 Haiti
Haiti
-
 Hong Kong
-
 Hungary
-
 India
India
-
 Indonesia
-
 Iran, Islamic republic
-
 Iraq
Iraq
-
 Ireland
-
 Israel
-
 Italy
Italy
-
 Jamaica
-
 Japan
Japan
-
 Jordan
-
 Kazakhstan
-
 Kenya
Kenya
-
 Korea
Korea
-
 Kuwait
-
 Kyrgyzstan
-
 Laos
Laos
-
 Latvia
-
 Lebanon
-
 Lesotho
-
 Libya
Libya
-
 Lithuania
-
 Luxembourg
-
 Madagascar
-
 Malaysia
-
 Malta
Malta
-
 Mauritius
-
 Mexico
-
 Moldova
-
 Mongolia
-
 Montenegro
-
 Morocco
-
 Mozambique
-
 Myanmar
-
 Namibia
-
 Nepal
Nepal
-
 Netherlands
-
 New Zealand
-
 Nigeria
-
 North Macedonia
-
 Norway
-
 Oman
Oman
-
 Pakistan
-
 Palestine
-
 Panama
-
 Papua New Guinea
-
 Paraguay
-
 Peru
Peru
-
 Philippines
-
 Poland
-
 Portugal
-
 Puerto Rico
-
 Qatar
Qatar
-
 Reunion
-
 Romania
-
 Rwanda
-
 Saudi Arabia
-
 Serbia
-
 Singapore
-
 Slovakia
-
 Slovenia
-
 Somalia
-
 South Africa
-
 Spain
Spain
-
 Sri Lanka
-
 Sweden
-
 Switzerland
-
 Syria
Syria
-
 Taiwan
-
 Tajikistan
-
 Tanzania
-
 Thailand
-
 Trinidad and Tobago
-
 Tunisia
-
 Turkey
-
 UAE
UAE
-
 Uganda
-
 Ukraine
-
 United Kingdom
-
United States
-
 Uruguay
-
 Uzbekistan
-
 Venezuela
-
 Vietnam
-
 Yemen
Yemen
-
 Zambia
-
 Zimbabwe
- Forex
- Crypto
