
Gram trades lower facing resistance at MA-50 near $2.014: weekly analysis

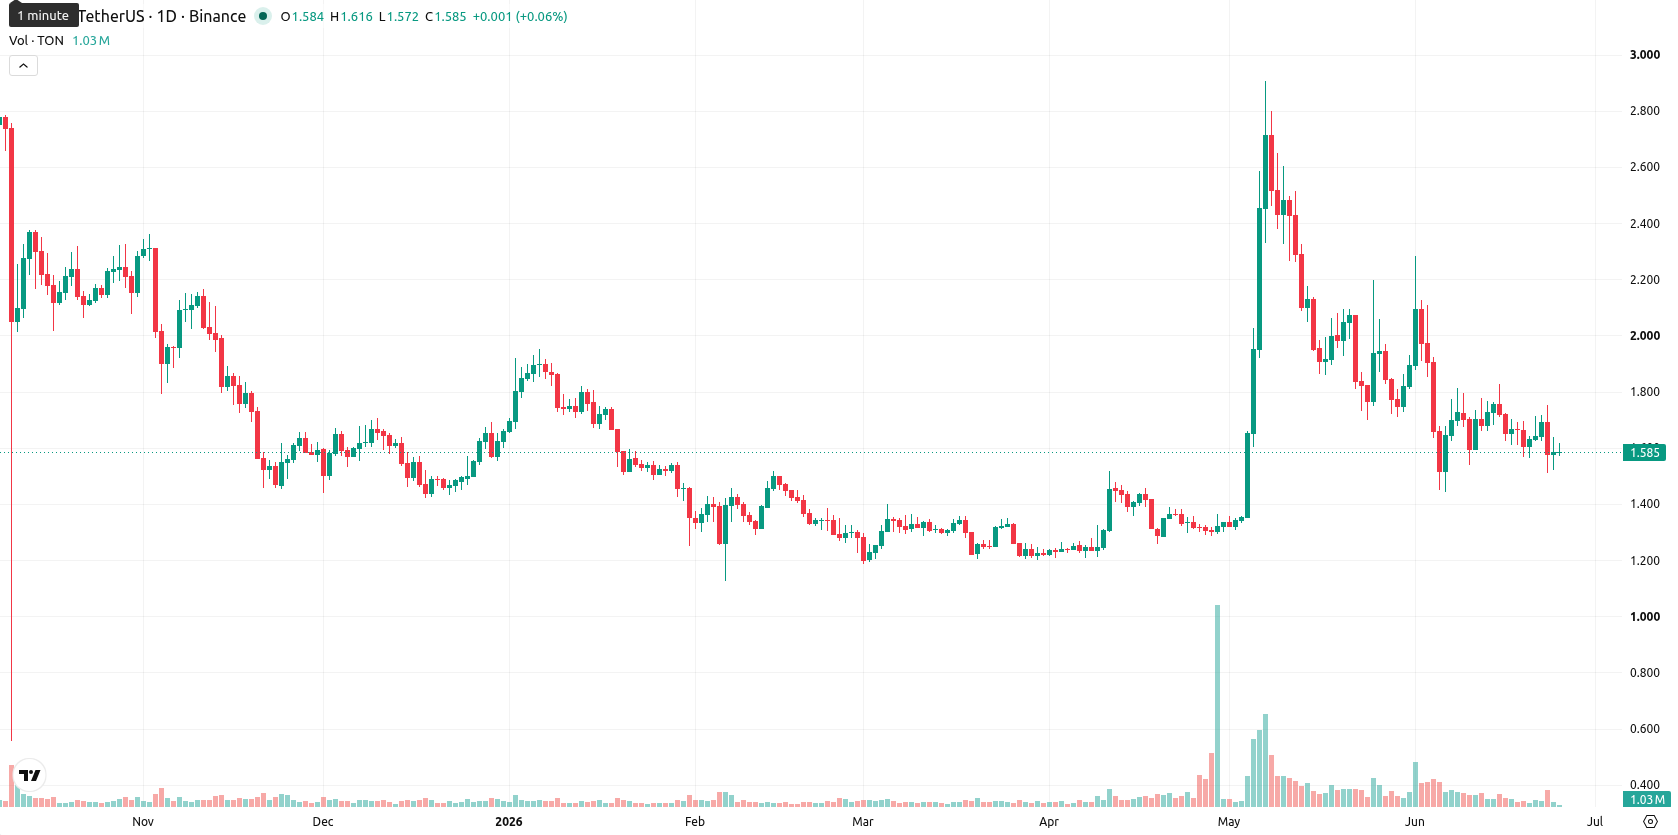
Gram (GRAM, formerly Toncoin) is trading at $1.592, positioned just above its weekly MA-20 at $1.525 but well below the MA-50 at $2.014. Over the last 7 days, GRAM fell $0.063 (3.99%) and spent most of the week in the lower portion of its range, indicating prevailing downward pressure while MA-20 acts as dynamic support.
Highlights
- GRAM maintains a bearish bias as it trades below medium- and long-term trend benchmarks, with short-term support near $1.51.
- Technical signals are mixed, with momentum oscillators lacking clear direction and MACD favoring further downside.
- The 7-day outlook expects GRAM to range between $1.51 and $1.75, with a 75% chance of continued decline absent a decisive upside breakout.
Mixed momentum and failure to rebound sustain bearish technical bias this week
Technical analysis on the weekly timeframe shows GRAM supported by MA-20 at $1.525, which acts as a near-term floor, while the MA-50 at $2.014 remains a strong resistance zone. Weekly volatility is elevated at 15.88%. Momentum signals are mixed: MACD issues a strong sell, ADX reflects active buyers, and oscillators such as RSI, Stochastic RSI, and CCI remain neutral to mildly bearish with no clear overbought or oversold conditions. Bull/Bear Power is mildly positive but is not enough to counter the ongoing price softness. The failure to recover in the second half of the week points to lingering weakness.
Sideways or lower trajectory seen next week as bullish signals remain scarce
Looking ahead to the next 7 days, the forecast expects GRAM to trade mainly between $1.51 and $1.75. Only one out of four key weekly indicators gives a buy signal, suggesting a 75% probability of further decline and only a 25% chance of meaningful upward movement. The base case calls for continued sideways or lower price action unless there is a decisive break above $1.75. If the $1.51 support fails, the asset may extend its recent downward trend.
In a recent review, Gram was characterized by persistent bearish momentum and weak prospects for a significant recovery. The latest weekly signals reinforce this cautious view, highlighting that continued downward price action remains the predominant risk unless a sustained move above $1.75 emerges.


Latest GRAM News


-
 Afghanistan
-
 Albania
-
 Algeria
-
 Angola
-
 Argentina
-
 Armenia
-
 Australia
-
 Austria
-
 Azerbaijan
-
 Bahamas
-
 Bahrain
-
 Bangladesh
-
 Belarus
-
 Belgium
-
 Bolivia
-
 Botswana
-
 Brazil
-
 Brunei
-
 Bulgaria
-
 Cambodia
-
 Cameroon
-
 Canada
-
 Chile
Chile
-
 China
China
-
 Colombia
-
 Congo
Congo
-
 Costa Rica
-
 Cote d'Ivoire
-
 Croatia
-
 Cuba
Cuba
-
 Cyprus
-
 Czechia
-
 DR Congo
-
 Denmark
-
 Dominican Republic
-
 Ecuador
-
 Egypt
Egypt
-
 El Salvador
-
 Estonia
-
 Eswatini
-
 Ethiopia
-
 Finland
-
 France
-
 Georgia
-
 Germany
-
 Ghana
Ghana
-
 Greece
-
 Haiti
Haiti
-
 Hong Kong
-
 Hungary
-
 India
India
-
 Indonesia
-
 Iran, Islamic republic
-
 Iraq
Iraq
-
 Ireland
-
 Israel
-
 Italy
Italy
-
 Jamaica
-
 Japan
Japan
-
 Jordan
-
 Kazakhstan
-
 Kenya
Kenya
-
 Korea
Korea
-
 Kuwait
-
 Kyrgyzstan
-
 Laos
Laos
-
 Latvia
-
 Lebanon
-
 Lesotho
-
 Libya
Libya
-
 Lithuania
-
 Luxembourg
-
 Madagascar
-
 Malaysia
-
 Malta
Malta
-
 Mauritius
-
 Mexico
-
 Moldova
-
 Mongolia
-
 Montenegro
-
 Morocco
-
 Mozambique
-
 Myanmar
-
 Namibia
-
 Nepal
Nepal
-
 Netherlands
-
 New Zealand
-
 Nigeria
-
 North Macedonia
-
 Norway
-
 Oman
Oman
-
 Pakistan
-
 Palestine
-
 Panama
-
 Papua New Guinea
-
 Paraguay
-
 Peru
Peru
-
 Philippines
-
 Poland
-
 Portugal
-
 Puerto Rico
-
 Qatar
Qatar
-
 Reunion
-
 Romania
-
 Rwanda
-
 Saudi Arabia
-
 Serbia
-
 Singapore
-
 Slovakia
-
 Slovenia
-
 Somalia
-
 South Africa
-
 Spain
Spain
-
 Sri Lanka
-
 Sweden
-
 Switzerland
-
 Syria
Syria
-
 Taiwan
-
 Tajikistan
-
 Tanzania
-
 Thailand
-
 Trinidad and Tobago
-
 Tunisia
-
 Turkey
-
 UAE
UAE
-
 Uganda
-
 Ukraine
-
 United Kingdom
-
United States
-
 Uruguay
-
 Uzbekistan
-
 Venezuela
-
 Vietnam
-
 Yemen
Yemen
-
 Zambia
-
 Zimbabwe
- Forex
- Crypto
