
Ongoing downside pressure pushes Aptos down sharply today

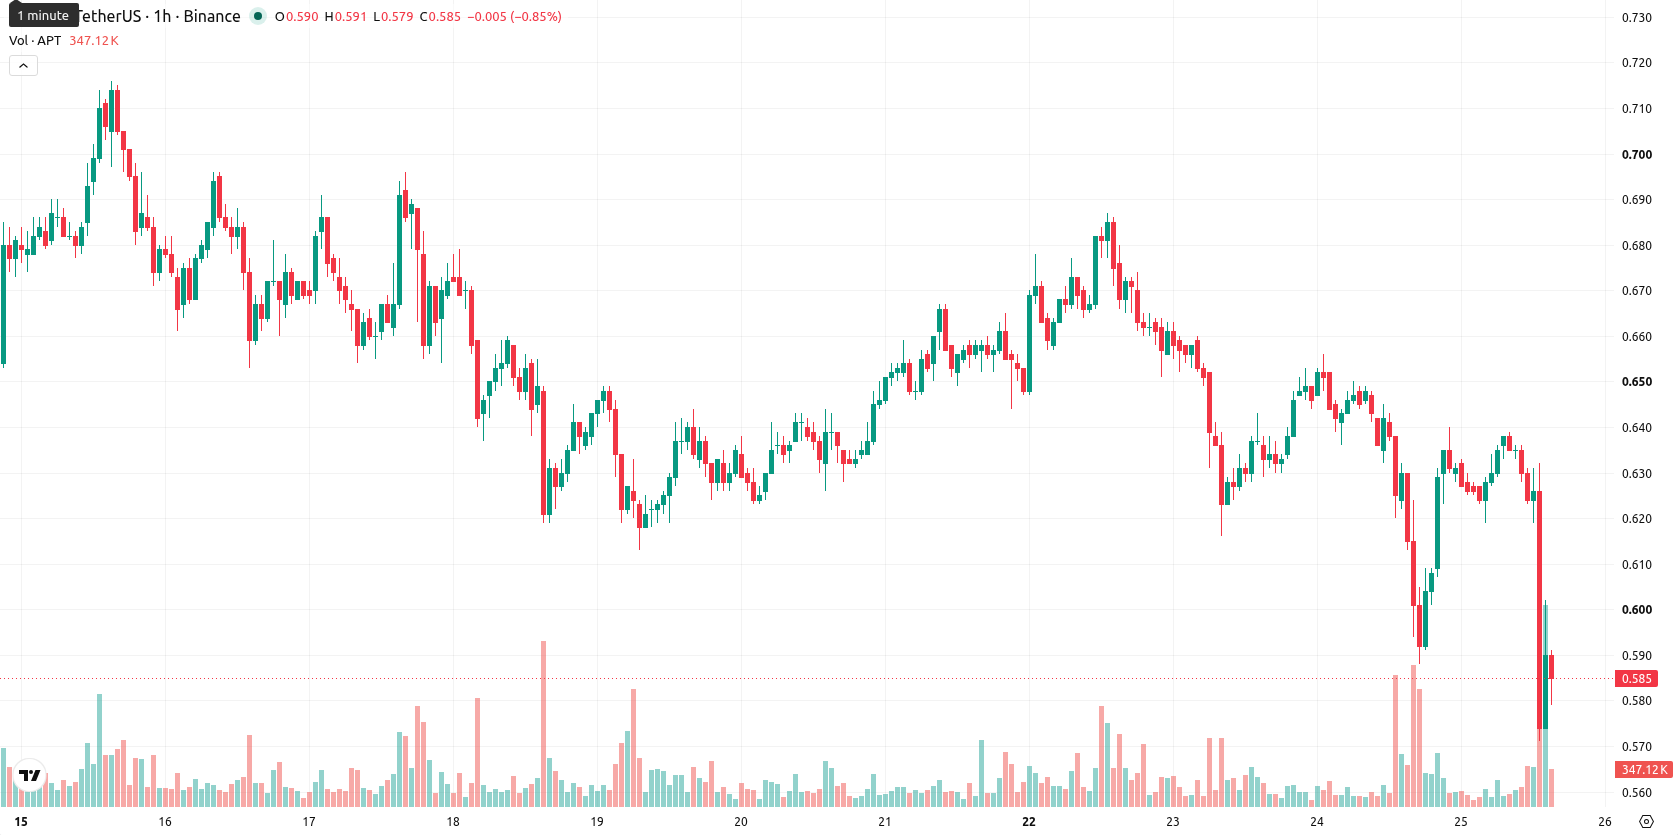
Aptos (APT) is trading at $0.581 after a steep drop of 7.19% today, underlining pronounced daily downside pressure. The asset remains below its key moving averages, reflecting sustained weakness relative to recent trends.
Highlights
- APT/USD is entrenched in a bearish trend, trading below key short- and long-term moving averages.
- Momentum indicators signal persistent selling pressure, with the pair experiencing oversold conditions and sustained intraday weakness.
- Expected price action for the next 2–3 sessions is between $0.5589 and $0.6031, with high probability of further downside unless support holds.
Bearish momentum persists as technical indicators confirm oversold conditions
On the hourly chart, APT/USD trades below the 20-period moving average at $0.6249 and the 50-period moving average at $0.6315, while on the daily timeframe, price is far below the 200-period moving average at $1.1364. The Ichimoku Kijun currently stands at $0.6125, acting as the nearest resistance. Relative Strength Index (RSI) registers deeply oversold at 28.379, while the Moving Average Convergence Divergence (MACD) and Average Directional Index (ADX) each confirm a prevailing negative momentum. Stochastic RSI and Commodity Channel Index (CCI) also signal oversold conditions, and Bull/Bear Power reinforces the dominance of sellers intraday; the Awesome Oscillator remains neutral, offering no counter-signal amid continued volatility.
High downside risk remains as narrow range limits bullish reversal
In the short term, APT is expected to fluctuate within a $0.5589–$0.6031 price range, characterized by high downside probability and minimal catalysts for an upward reversal. Should price break above immediate resistance at $0.6125, a brief bounce could develop. Conversely, a decline through support at $0.5589 would likely extend the bearish bias, potentially leading to further downside volatility.
Earlier, analysts noted that persistent bearish momentum and structural weakness continued to drive downside risk for Aptos. The current technical setup not only confirms this negative outlook but also signals that traders should monitor the $0.5589 support as a pivotal level for potential further losses.


-
 Afghanistan
-
 Albania
-
 Algeria
-
 Angola
-
 Argentina
-
 Armenia
-
 Australia
-
 Austria
-
 Azerbaijan
-
 Bahamas
-
 Bahrain
-
 Bangladesh
-
 Belarus
-
 Belgium
-
 Bolivia
-
 Botswana
-
 Brazil
-
 Brunei
-
 Bulgaria
-
 Cambodia
-
 Cameroon
-
 Canada
-
 Chile
Chile
-
 China
China
-
 Colombia
-
 Congo
Congo
-
 Costa Rica
-
 Cote d'Ivoire
-
 Croatia
-
 Cuba
Cuba
-
 Cyprus
-
 Czechia
-
 DR Congo
-
 Denmark
-
 Dominican Republic
-
 Ecuador
-
 Egypt
Egypt
-
 El Salvador
-
 Estonia
-
 Eswatini
-
 Ethiopia
-
 Finland
-
 France
-
 Georgia
-
 Germany
-
 Ghana
Ghana
-
 Greece
-
 Haiti
Haiti
-
 Hong Kong
-
 Hungary
-
 India
India
-
 Indonesia
-
 Iran, Islamic republic
-
 Iraq
Iraq
-
 Ireland
-
 Israel
-
 Italy
Italy
-
 Jamaica
-
 Japan
Japan
-
 Jordan
-
 Kazakhstan
-
 Kenya
Kenya
-
 Korea
Korea
-
 Kuwait
-
 Kyrgyzstan
-
 Laos
Laos
-
 Latvia
-
 Lebanon
-
 Lesotho
-
 Libya
Libya
-
 Lithuania
-
 Luxembourg
-
 Madagascar
-
 Malaysia
-
 Malta
Malta
-
 Mauritius
-
 Mexico
-
 Moldova
-
 Mongolia
-
 Montenegro
-
 Morocco
-
 Mozambique
-
 Myanmar
-
 Namibia
-
 Nepal
Nepal
-
 Netherlands
-
 New Zealand
-
 Nigeria
-
 North Macedonia
-
 Norway
-
 Oman
Oman
-
 Pakistan
-
 Palestine
-
 Panama
-
 Papua New Guinea
-
 Paraguay
-
 Peru
Peru
-
 Philippines
-
 Poland
-
 Portugal
-
 Puerto Rico
-
 Qatar
Qatar
-
 Reunion
-
 Romania
-
 Rwanda
-
 Saudi Arabia
-
 Serbia
-
 Singapore
-
 Slovakia
-
 Slovenia
-
 Somalia
-
 South Africa
-
 Spain
Spain
-
 Sri Lanka
-
 Sweden
-
 Switzerland
-
 Syria
Syria
-
 Taiwan
-
 Tajikistan
-
 Tanzania
-
 Thailand
-
 Trinidad and Tobago
-
 Tunisia
-
 Turkey
-
 UAE
UAE
-
 Uganda
-
 Ukraine
-
 United Kingdom
-
United States
-
 Uruguay
-
 Uzbekistan
-
 Venezuela
-
 Vietnam
-
 Yemen
Yemen
-
 Zambia
-
 Zimbabwe
- Forex
- Crypto
