
HBAR slips amid continued bearish momentum below key moving averages: weekly outlook

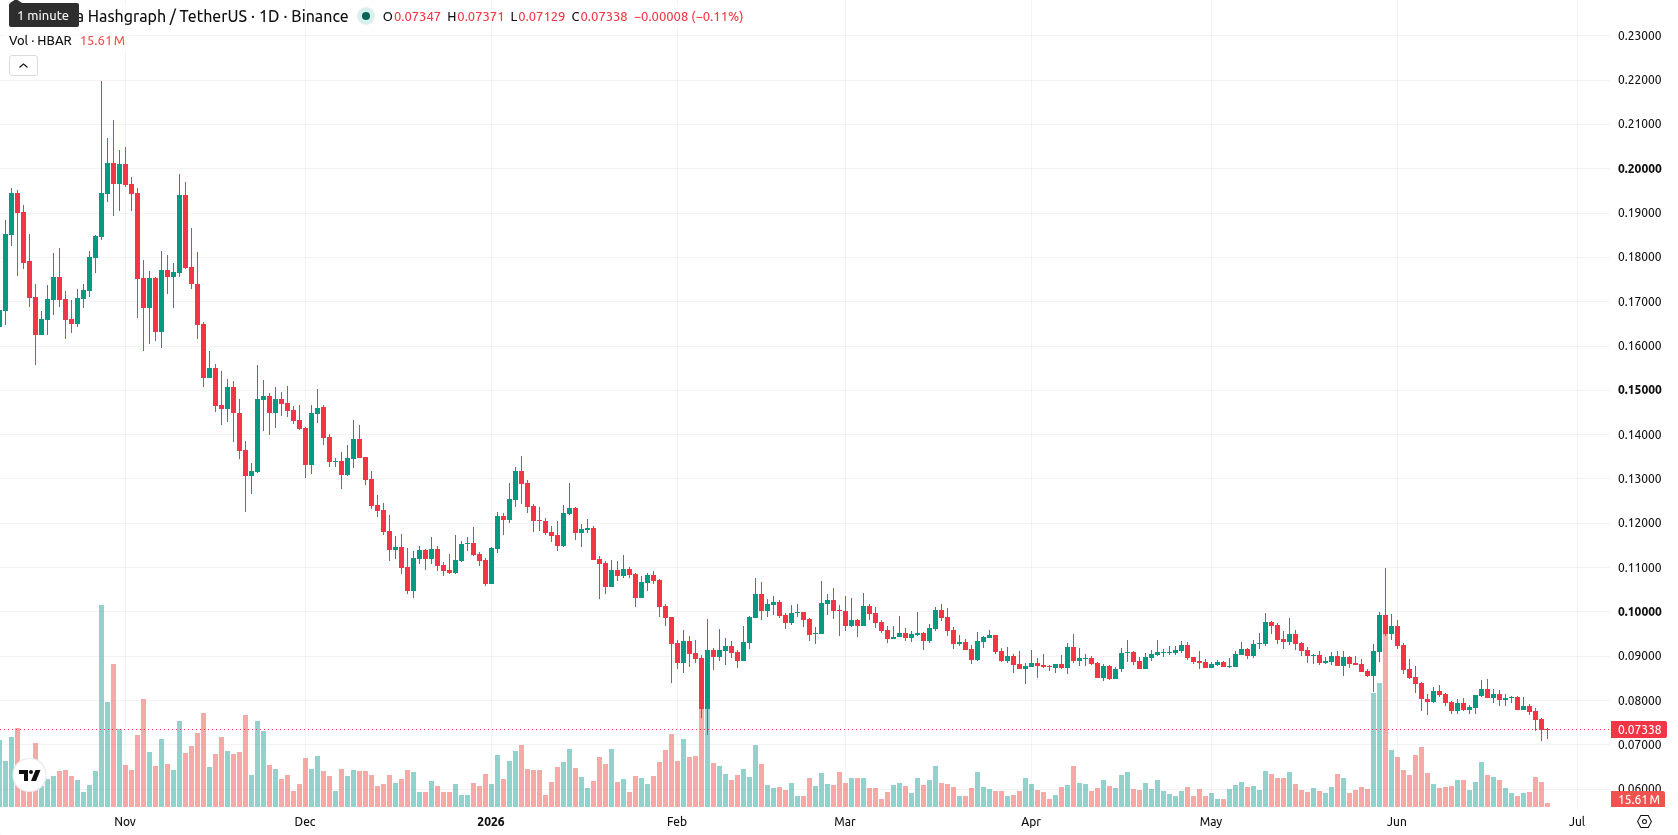
Hedera (HBAR) is currently trading at $0.0734, marking a weekly loss of $0.0059 or 7.41%. The asset remains well below its weekly MA-20 at $0.0895, MA-50 at $0.1433, and MA-200 at $0.1108, reflecting strong downward momentum across medium- and long-term moving averages.
Highlights
- HBAR trades well below major moving averages, confirming sustained downward momentum in both medium- and long-term trends.
- All key technical indicators are firmly bearish, with oversold signals and persistent negative momentum dominating weekly charts.
- HBAR is likely to drift sideways within $0.063 to $0.084 next week, with high risk of further declines if support at $0.069 breaks.
Ecosystem growth and regulatory clarity bolster sentiment during the week
Hedera has strengthened its enterprise credentials with over $10 billion in real-world asset settlements, spanning tokenized bonds, supply chain tracking, and cross-border payments. The Governing Council expanded to 31 members, including Google, IBM, Boeing, and NVIDIA, which has historically led to new integrations and ecosystem growth. Regulatory clarity improved after the SEC-CFTC classified HBAR as a digital commodity in 2026, reducing legal uncertainties for the network and encouraging institutional involvement. Hedera’s carbon-negative proof-of-stake model and energy efficiency continue to drive ESG-focused adoption.
Bearish momentum confirmed as indicators signal persistent downside
Technical signals on the weekly chart remain bearish. The price sits near the lower end of the recent weekly range and remains firmly below all key moving averages (MA-20, MA-50, MA-200), with the MA-20 and MA-50 now acting as overhead resistance. Momentum and trend indicators, including weekly MACD and ADX, affirm a dominant bearish trend. RSI and CCI are both in oversold territory, and Stochastic RSI also signals oversold conditions, while Bull/Bear Power favors sellers. Weekly volatility is relatively high at 14.43%. Support is found near $0.0694, while resistance lies in the $0.084 – $0.0917 range.
Rangebound outlook with downside risk as volatility shapes near-term bias
For the next 7 days, HBAR is likely to remain rangebound, with trading mostly contained between $0.063 and $0.084, reflecting a corridor defined by recent volatility. A sustained move above $0.084 – $0.092 could trigger a short-term bullish reversal, but this scenario shows a probability of less than 20% based on W1 technicals. The baseline scenario is for HBAR to drift sideways with a modest bias to the downside, and any break below $0.069 would expose further downside risk.
In a recent review, analysts highlighted that Hedera’s persistent weakness below key moving averages was a sign of prevailing bearish momentum despite growing institutional adoption. This latest analysis not only reinforces that outlook with continued downside pressure but underscores that a decisive break below $0.069 would open the door to additional short-term downside risk for HBAR.


-
 Afghanistan
-
 Albania
-
 Algeria
-
 Angola
-
 Argentina
-
 Armenia
-
 Australia
-
 Austria
-
 Azerbaijan
-
 Bahamas
-
 Bahrain
-
 Bangladesh
-
 Belarus
-
 Belgium
-
 Bolivia
-
 Botswana
-
 Brazil
-
 Brunei
-
 Bulgaria
-
 Cambodia
-
 Cameroon
-
 Canada
-
 Chile
Chile
-
 China
China
-
 Colombia
-
 Congo
Congo
-
 Costa Rica
-
 Cote d'Ivoire
-
 Croatia
-
 Cuba
Cuba
-
 Cyprus
-
 Czechia
-
 DR Congo
-
 Denmark
-
 Dominican Republic
-
 Ecuador
-
 Egypt
Egypt
-
 El Salvador
-
 Estonia
-
 Eswatini
-
 Ethiopia
-
 Finland
-
 France
-
 Georgia
-
 Germany
-
 Ghana
Ghana
-
 Greece
-
 Haiti
Haiti
-
 Hong Kong
-
 Hungary
-
 India
India
-
 Indonesia
-
 Iran, Islamic republic
-
 Iraq
Iraq
-
 Ireland
-
 Israel
-
 Italy
Italy
-
 Jamaica
-
 Japan
Japan
-
 Jordan
-
 Kazakhstan
-
 Kenya
Kenya
-
 Korea
Korea
-
 Kuwait
-
 Kyrgyzstan
-
 Laos
Laos
-
 Latvia
-
 Lebanon
-
 Lesotho
-
 Libya
Libya
-
 Lithuania
-
 Luxembourg
-
 Madagascar
-
 Malaysia
-
 Malta
Malta
-
 Mauritius
-
 Mexico
-
 Moldova
-
 Mongolia
-
 Montenegro
-
 Morocco
-
 Mozambique
-
 Myanmar
-
 Namibia
-
 Nepal
Nepal
-
 Netherlands
-
 New Zealand
-
 Nigeria
-
 North Macedonia
-
 Norway
-
 Oman
Oman
-
 Pakistan
-
 Palestine
-
 Panama
-
 Papua New Guinea
-
 Paraguay
-
 Peru
Peru
-
 Philippines
-
 Poland
-
 Portugal
-
 Puerto Rico
-
 Qatar
Qatar
-
 Reunion
-
 Romania
-
 Rwanda
-
 Saudi Arabia
-
 Serbia
-
 Singapore
-
 Slovakia
-
 Slovenia
-
 Somalia
-
 South Africa
-
 Spain
Spain
-
 Sri Lanka
-
 Sweden
-
 Switzerland
-
 Syria
Syria
-
 Taiwan
-
 Tajikistan
-
 Tanzania
-
 Thailand
-
 Trinidad and Tobago
-
 Tunisia
-
 Turkey
-
 UAE
UAE
-
 Uganda
-
 Ukraine
-
 United Kingdom
-
United States
-
 Uruguay
-
 Uzbekistan
-
 Venezuela
-
 Vietnam
-
 Yemen
Yemen
-
 Zambia
-
 Zimbabwe
- Forex
- Crypto
